A Silent Crisis in the Hotel Industry
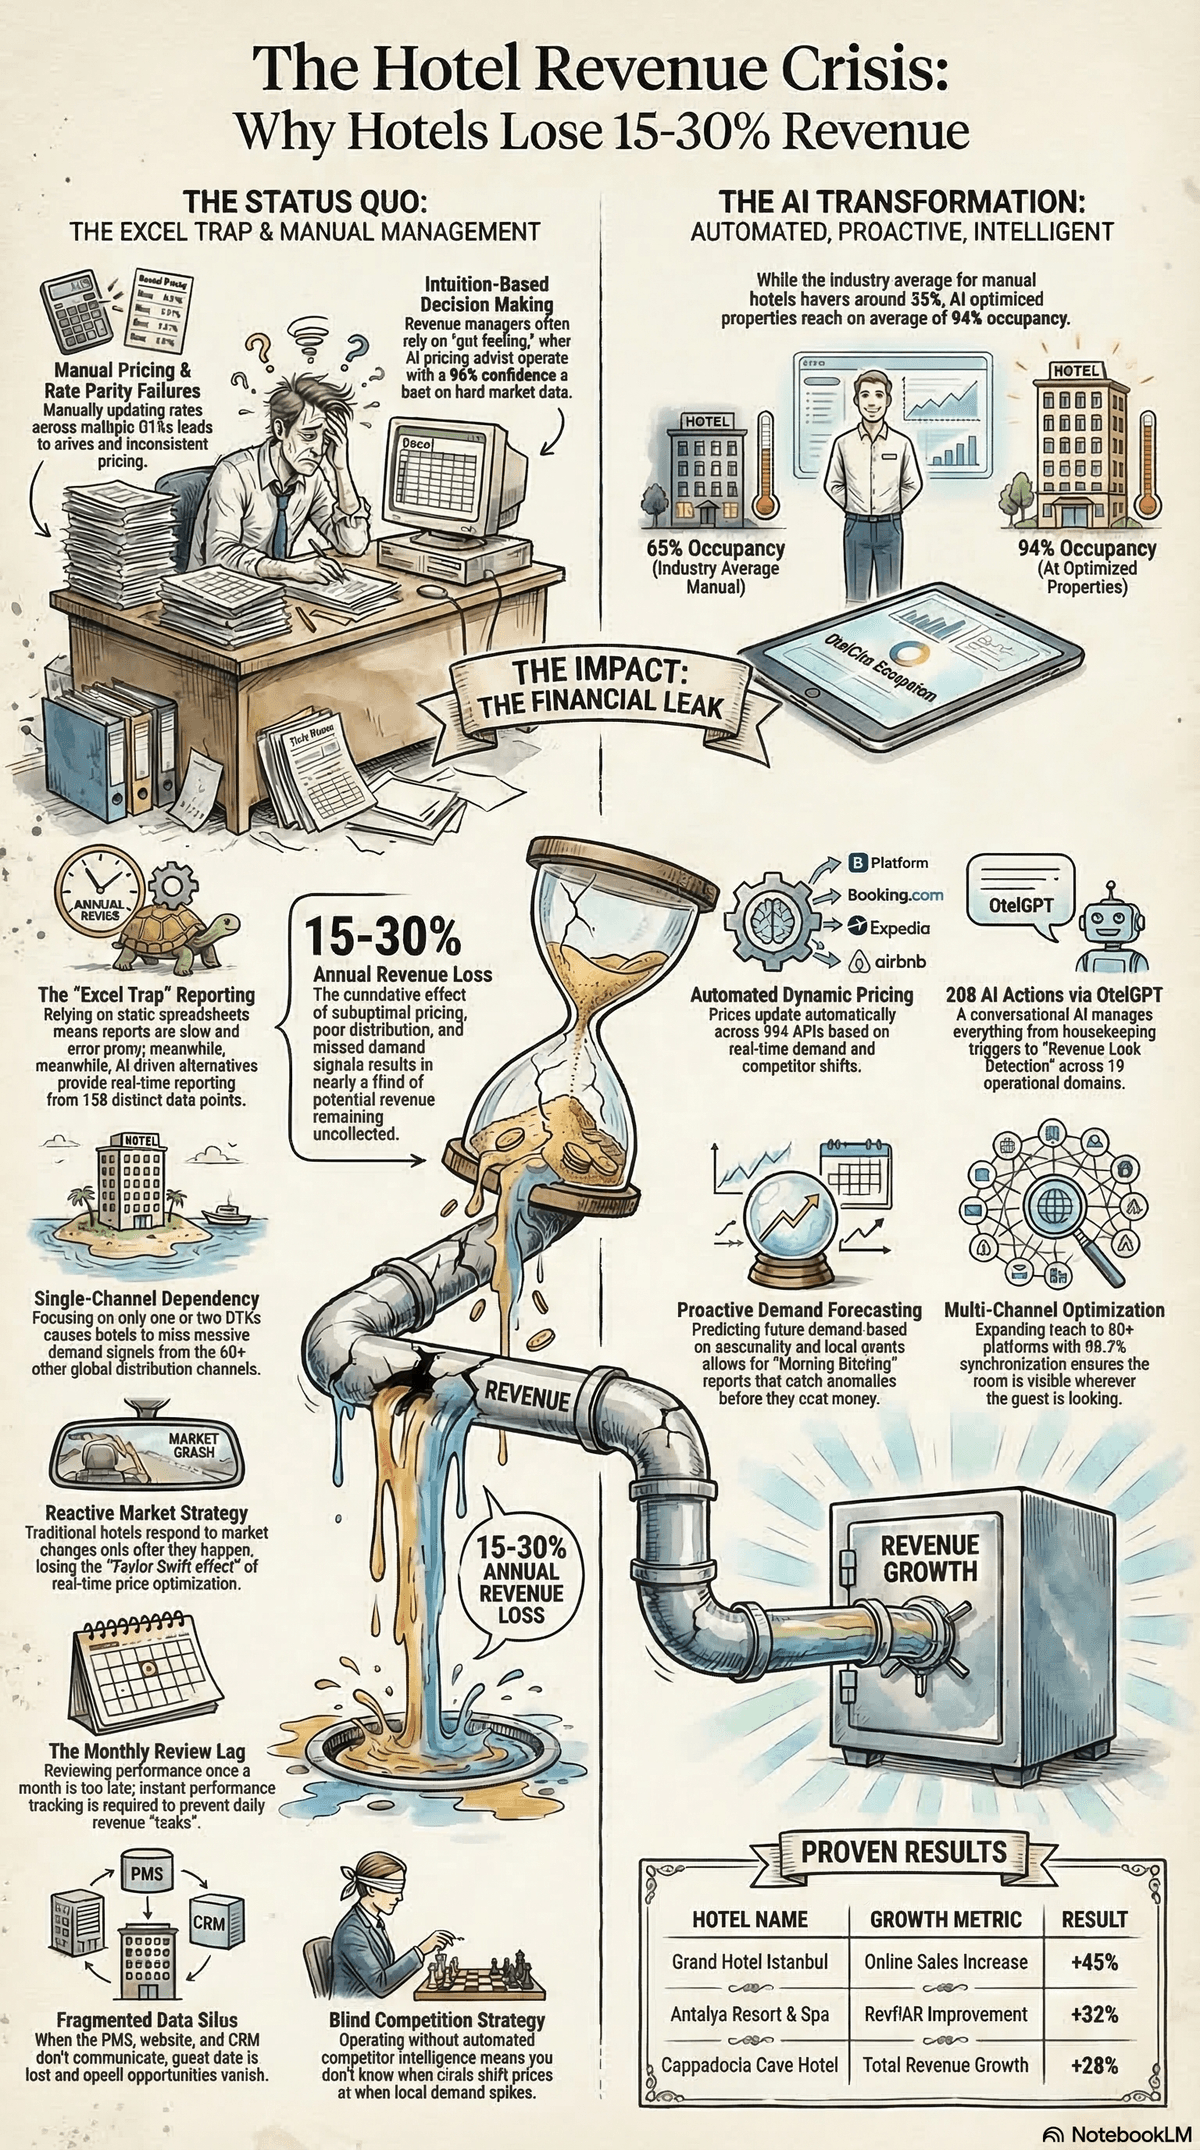
The vast majority of hotels lose between 15% and 30% of their total revenue every year. This loss does not happen overnight — it accumulates through daily small decisions made throughout the year. A mispriced room here, a missed demand wave there, an outdated channel listing over there. The result: millions in lost revenue.

Embed this image on your site
<a href="https://otelciro.com/en/news/otel-gelir-krizi-neden-kayip">
  <img src="https://cdn.sanity.io/images/1la98t0z/production/6e0f13067981420f38f500d478c98349763eaf61-1200x2150.png" alt="Hotel Revenue Crisis Infographic — From the Excel trap to AI transformation" width="800" />
</a>
<p>Source: <a href="https://otelciro.com">OtelCiro</a> — AI Hotel Revenue Management</p>
So where does this loss come from? And more importantly, how can it be prevented?
Related reading: 65% of Travelers Accept Dynamic Pricing: Transparency Builds Trust
The Status Quo: The Excel Trap and Intuition-Based Management
Intuition-Based Pricing Is Deceptive
Research shows that pricing decisions based solely on intuition have a mere 4% accuracy rate. Out of 100 decisions where a revenue manager says "this price feels right," only 4 actually produce optimal results. The remaining 96 either leave revenue on the table with prices set too low or drive away guests with prices set too high.
Hotels Trapped in Spreadsheets
According to industry research, 13% of hotels still use Excel for pricing. These properties typically get stuck in the following cycle:
- Fixed price tables set at the beginning of the season
- Rack rates updated only 2-3 times per year
- Competitor prices checked manually (once or twice a day at best)
- Previous year data reused through copy-paste
- Forecasting replaced by "whatever we did last year" logic
Competing in a dynamic market with this approach is like driving with the handbrake on.
Embed this image on your site
<a href="https://otelciro.com/en/news/otel-gelir-krizi-neden-kayip">
  <img src="https://cdn.sanity.io/images/1la98t0z/production/7aad3e230cde611ee176402d03b7bcf0a35316f2-1200x2150.png" alt="RevPAR improvement strategies and tactics" width="800" />
</a>
<p>Source: <a href="https://otelciro.com">OtelCiro</a> — AI Hotel Revenue Management</p>
The Cost of Manual Pricing and Channel Management
Manual Updates Across 10+ Channels
In today's distribution ecosystem, the average hotel maintains a presence across more than 10 sales channels: Booking.com, Expedia, HRS, Hotelbeds, Google Hotels, direct website, phone, walk-in, and more. Updating prices, availability, and content across each channel takes an average of 3-4 hours per day.
During this time:
- Rate parity violations become inevitable
- Old prices remain on some channels for hours
- Booking.com's hidden penalties get triggered
- Overbooking or underbooking risks increase
Rate Parity Failures
Maintaining rate parity with manual channel management is nearly impossible. While you update the price on one channel, the old price lingers on another. When OTAs detect these inconsistencies, they lower your ranking and reduce your visibility — often without you even noticing.
Related reading: Hotel Revenue Management Guide: Strategies, Metrics & Technology (2026)
The Scale of Losses: Where Does 15-30% Go?
Annual revenue loss stems from three main sources:
1. Suboptimal Pricing (8-15% loss)
Selling at low prices when demand is high, holding high prices when demand drops. For hotels that do not use dynamic pricing, this represents the largest revenue leak. Selling at rack rate throughout a convention week means leaving thousands in ADR opportunity on the table.
2. Poor Distribution Strategy (4-8% loss)
Putting all eggs in one basket — say, 80% Booking.com dependency — both increases commission costs and weakens your bargaining power. Without proper 5-channel optimization, revenue from lower-commission channels is forfeited.
3. Missed Demand and Empty Rooms (3-7% loss)
The true cost of an empty room is not just the unsold revenue — fixed costs continue to accrue. At the industry average occupancy of 65%, a 100-room hotel means 35 empty rooms every night. Annually, that translates to 12,775 unsold room nights.
Embed this image on your site
<a href="https://otelciro.com/en/news/otel-gelir-krizi-neden-kayip">
  <img src="https://cdn.sanity.io/images/1la98t0z/production/e4a81170ea23bc3464834633cf98f17b6e55f514-1200x669.png" alt="Hotel dynamic pricing strategies comparison" width="800" />
</a>
<p>Source: <a href="https://otelciro.com">OtelCiro</a> — AI Hotel Revenue Management</p>
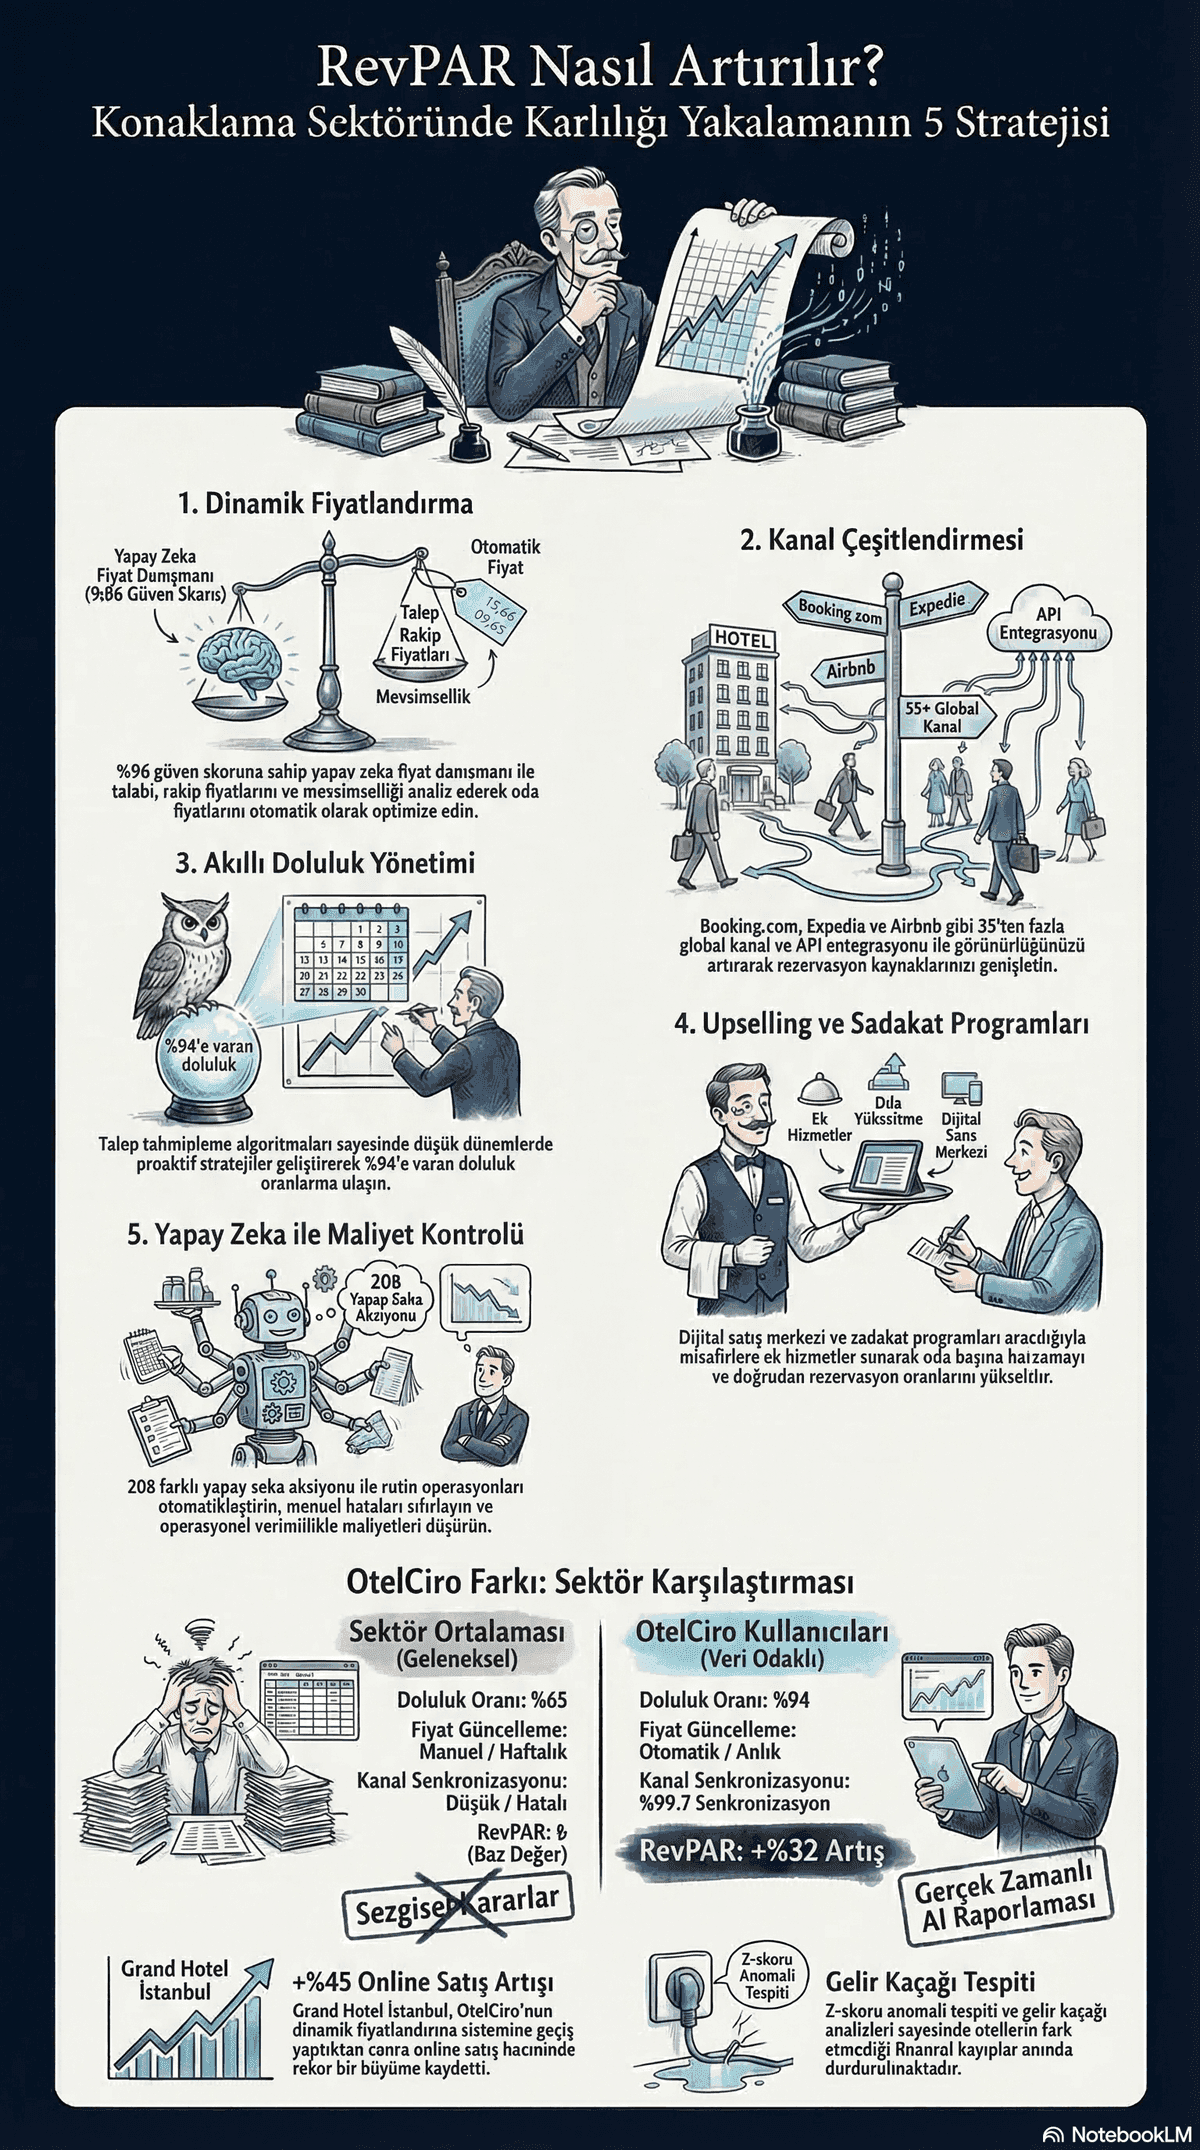
Industry Average vs AI-Optimized Properties
The numbers speak for themselves:
| Metric | Industry Average | AI-Optimized Hotel |
|---|---|---|
| Occupancy rate | 65% | 94% |
| Price update frequency | Weekly/monthly | Hourly |
| Demand forecast accuracy | 4% (intuition) | 92%+ (AI) |
| Channel update time | 3-4 hours/day | Automatic, instant |
| Revenue optimization | Reactive | Proactive |
Moving from 65% to 94% occupancy means up to a 45% revenue increase with the same room capacity.
Related reading: AI Revenue Management Platform: The Complete Hotel Solution for 2026
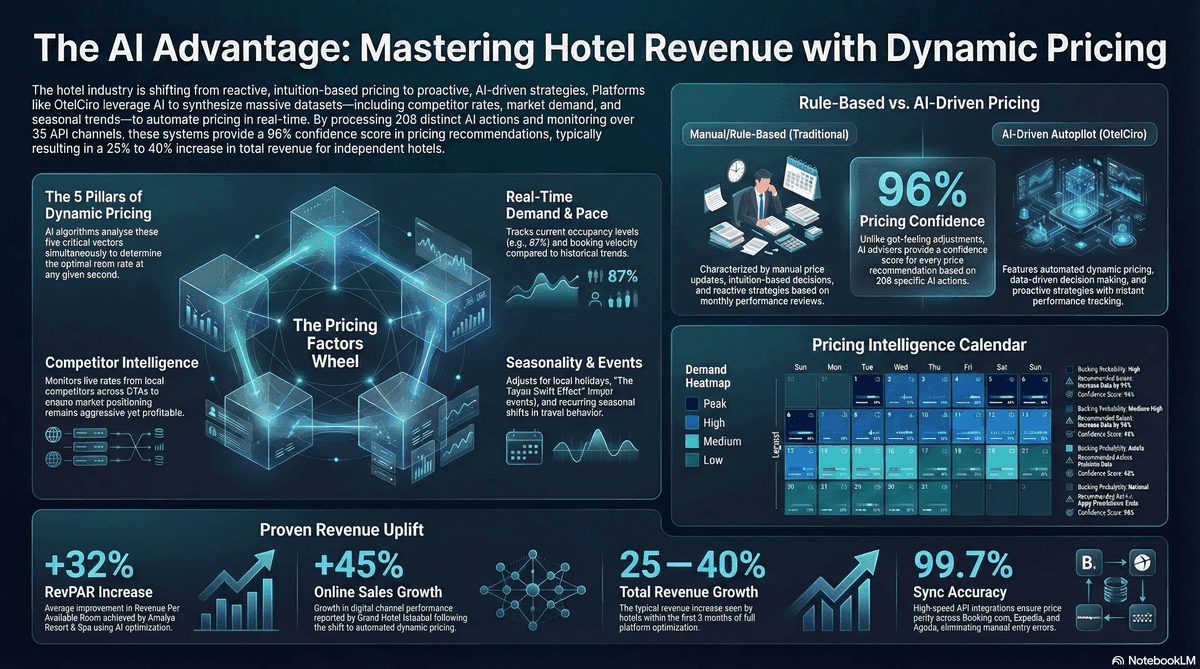
The AI Transformation: Automated, Proactive, Intelligent
208 AI Actions via OtelGPT
OtelCiro's conversational AI engine, OtelGPT, can execute 208 actions across 14 different domains. From price optimization to channel management, demand forecasting to competitor analysis, all revenue management processes run through a single AI engine.
What does this mean in practice?
- Proactive demand forecasting: Detects demand signals such as conventions, festivals, and weather changes in advance
- Multi-channel optimization: 99.7% synchronization rate across 35+ API integrations
- Real-time pricing: Automatic price adjustments as market conditions change
- Revenue leak detection: Instant identification of overbooking, parity violations, and underperforming channels
You can explore the impact of AI on hotel revenue forecasting in greater detail.
Proven Results
Results from hotels that completed OtelCiro's full optimization process over a 2-3 month period:
| Hotel | Result |
|---|---|
| Grand Hotel Istanbul | +45% online sales growth |
| Antalya Resort & Spa | +32% total revenue growth |
| Cappadocia Cave Hotel | +28% total revenue growth |
| Average | +32% revenue growth |
These results were achieved not through major investments or room additions, but through smarter management of existing capacity.
The Roadmap Out of Crisis
Step 1: Measure Your Current State
You cannot solve a problem you have not measured. Answer these questions:
- What is your average occupancy rate over the last 12 months?
- How does your ADR compare to competitors?
- How many channels are you actively selling on, and what is your average commission rate?
- How frequently do you update your prices?
Step 2: Move from Excel to Data-Driven Systems
The transition from intuition to data is the first step in the transformation. Understanding the difference between dynamic and static pricing makes it clear why this shift is necessary.
Step 3: Optimize Your Channel Distribution
Break free from single-OTA dependency. Strengthen your direct booking channel, establish a presence on metasearch, and prepare for AI agents.
Step 4: Adopt AI-Powered Revenue Management
Moving from manual processes to AI-powered automation does not just save time — it fundamentally changes the quality of decisions. OtelCiro's AI engine brings all these steps together on an integrated platform.
Conclusion: Every Day of Delay Compounds the Loss
The hotel revenue crisis is not something that can be fixed overnight — but every day of delay compounds the losses. Shifting from intuition-based decisions with 4% accuracy to AI predictions with 92%+ accuracy is the key not just to survival, but to growth in the hospitality industry.
An average +32% revenue increase has moved from the "AI would be nice" category to "we cannot compete without AI." The question is no longer "should we use AI?" — it is "how much longer can we wait?"
Want to discover your hotel's revenue potential? Get in touch for a free revenue analysis.
![Hotel Upselling: AI-Driven Revenue Growth [2026]](https://cdn.sanity.io/images/1la98t0z/production/9850350573fc466b95b1490c7f689e8ac39c4f11-1200x669.png?w=1920&q=50&auto=format&fit=max)