![Hotel KPI Dashboard: 20 Essential Metrics [2026]](https://cdn.sanity.io/images/1la98t0z/production/38f1aa978e360687d028416ec63587bba3c9beb7-1376x768.jpg?w=1920&q=65&auto=format&fit=max)
You Cannot Improve What You Cannot Measure
The difference between a hotel that consistently outperforms its comp set and one that struggles is rarely location, product quality, or luck. It is measurement. Hotels that track and act on the right KPIs make better decisions, faster — and the compound effect of better daily decisions over months and years creates an insurmountable competitive advantage.
Yet many hotel GMs still rely on three metrics: occupancy, ADR, and RevPAR. While these are important, they represent only the tip of the performance iceberg. In 2026, top-performing hotels track 15-20 KPIs across revenue, operations, marketing, and guest satisfaction — each providing unique insight into a different dimension of performance.

Embed this image on your site
<a href="https://otelciro.com/en/news/hotel-kpi-metrics-dashboard">
  <img src="https://cdn.sanity.io/images/1la98t0z/production/38f1aa978e360687d028416ec63587bba3c9beb7-1376x768.jpg" alt="Hotel KPI metrics dashboard infographic" width="800" />
</a>
<p>Source: <a href="https://otelciro.com">OtelCiro</a> — AI Hotel Revenue Management</p>
Related reading: Hotel Revenue Metrics & KPI Guide: From RevPAR to GOPPAR
Related reading: Dynamic vs. Static Pricing: How the Taylor Swift Effect Can Skyrocket Your Revenue
Revenue KPIs
1. RevPAR (Revenue Per Available Room)
Formula: Total Room Revenue / Total Available Rooms Benchmark: Varies by market — global upper midscale average: $130 Why it matters: The single best composite measure of revenue performance, capturing both pricing power and demand generation.
2. ADR (Average Daily Rate)
Formula: Total Room Revenue / Rooms Sold Benchmark: Upper midscale average: $170 Why it matters: Measures pricing effectiveness. Rising ADR with stable occupancy indicates pricing power growth.
3. TRevPAR (Total Revenue Per Available Room)
Formula: Total Hotel Revenue (all departments) / Available Rooms Benchmark: Typically 1.3-1.8x RevPAR Why it matters: Captures revenue from F&B, spa, parking, and ancillary services — increasingly important as total revenue management gains prominence.
4. GOPPAR (Gross Operating Profit Per Available Room)
Formula: Gross Operating Profit / Available Rooms Benchmark: Varies widely — healthy range: 35-50% of TRevPAR Why it matters: The most important metric for owners and investors. Revenue is vanity, profit is sanity.
5. Net RevPAR
Formula: (Room Revenue - Distribution Costs) / Available Rooms Benchmark: Should be 80-95% of gross RevPAR Why it matters: Accounts for the true cost of earning revenue. A $200 OTA booking at 20% commission nets $160; a $190 direct booking nets $185.
Embed this image on your site
<a href="https://otelciro.com/en/news/hotel-kpi-metrics-dashboard">
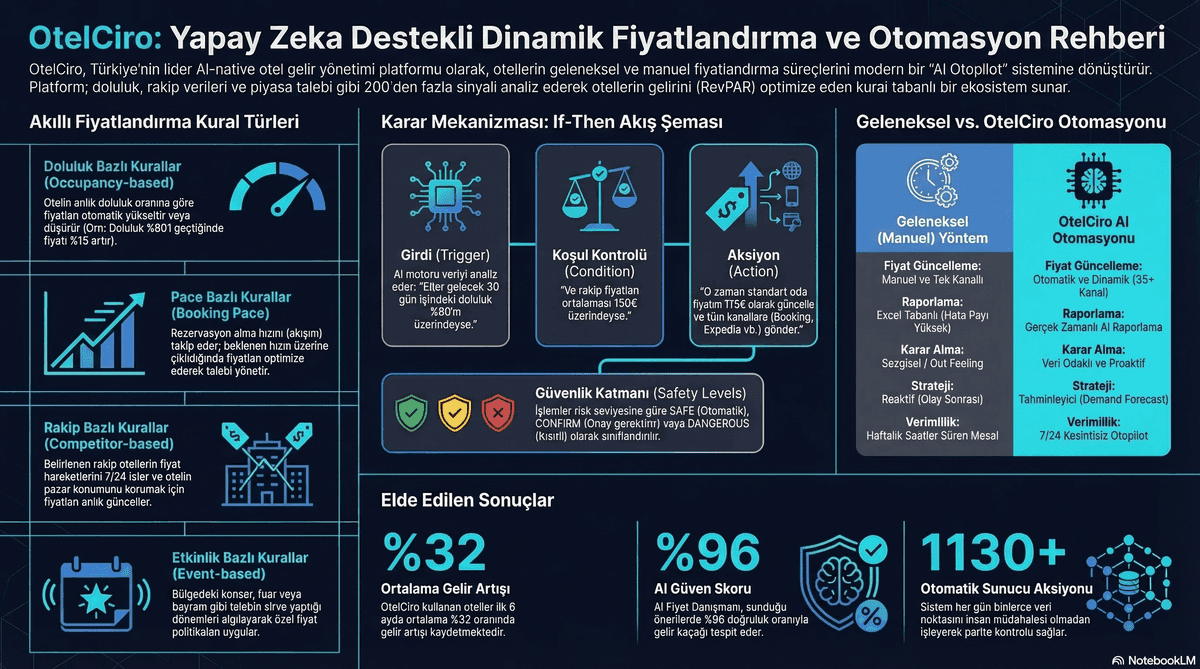
<img src="https://cdn.sanity.io/images/1la98t0z/production/2d9c99599d308dc44740f17d18a63ef05a6a3127-1200x669.png" alt="Hotel automated pricing rules engine" width="800" />
</a>
<p>Source: <a href="https://otelciro.com">OtelCiro</a> — AI Hotel Revenue Management</p>
Occupancy and Demand KPIs
6. Occupancy Rate
Formula: Rooms Sold / Available Rooms × 100 Benchmark: Healthy: 70-85% annually Why it matters: Foundation metric, but must be read alongside ADR. 100% occupancy at fire-sale rates is not success.
7. Booking Pace (Pick-Up)
Formula: Rooms on the books for future date vs. same date last year Benchmark: Compare to prior year same period Why it matters: The leading indicator. Pace tells you whether future performance is trending up or down while there is still time to act.
8. Average Length of Stay (ALOS)
Formula: Total Room Nights Sold / Number of Reservations Benchmark: City: 1.8-2.5 nights; Resort: 3.5-7 nights Why it matters: Longer stays reduce operational costs per room night and increase ancillary revenue opportunity.
9. Cancellation Rate
Formula: Cancelled Reservations / Total Reservations × 100 Benchmark: Industry average: 25-35% (varies by channel) Why it matters: High cancellation rates distort forecasting and create revenue risk. Track by channel to identify problematic sources.
Related reading: AI Revenue Management Platform: The Complete Hotel Solution for 2026
Related reading: 65% of Travelers Accept Dynamic Pricing: Transparency Builds Trust
Distribution KPIs
10. Direct Booking Ratio
Formula: Direct Bookings / Total Bookings × 100 Benchmark: Leaders: 40-55%; Average: 25-30% Why it matters: Every percentage point shift from OTA to direct saves 12-18% in commission.
11. Cost of Acquisition (COA)
Formula: Total Distribution + Marketing Costs / Total Bookings Benchmark: Direct: $8-15; OTA: $30-50 Why it matters: Reveals the true cost of each booking. Helps prioritize channels by profitability.
12. Channel Mix
Formula: Revenue % by channel Benchmark: Optimal varies by property type Why it matters: Concentration risk. Over 60% from a single channel creates dangerous dependency.
Embed this image on your site
<a href="https://otelciro.com/en/news/hotel-kpi-metrics-dashboard">
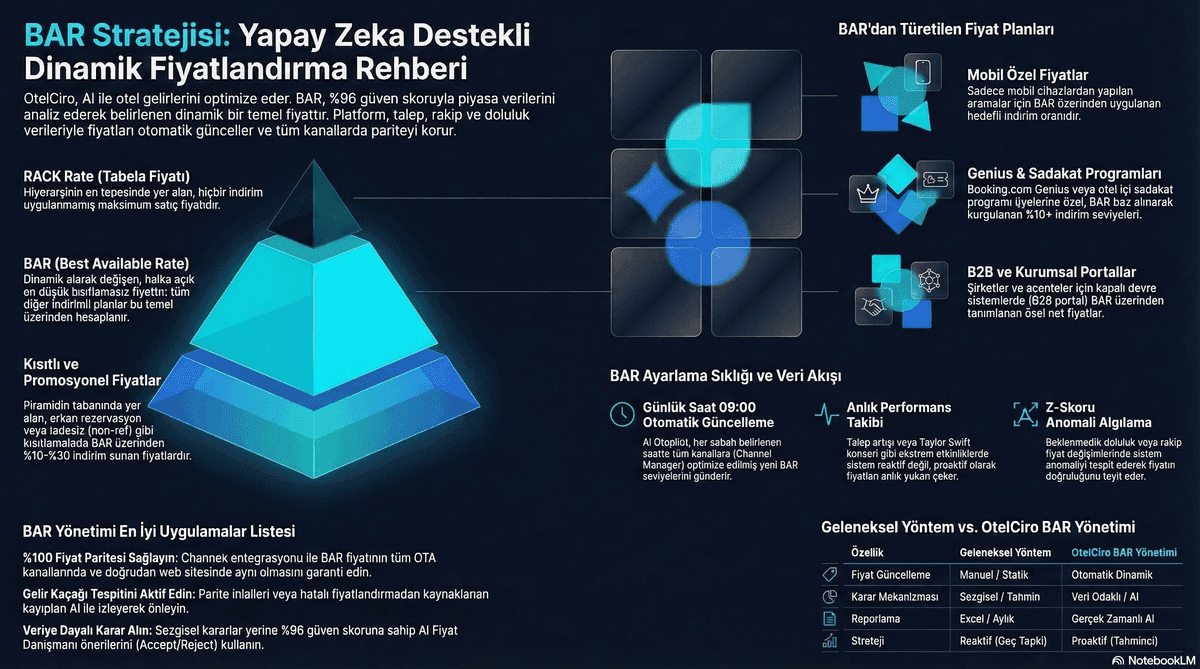
<img src="https://cdn.sanity.io/images/1la98t0z/production/d709171e0716efa2509216ec7e4818587f2b5b65-1200x669.png" alt="BAR (Best Available Rate) pricing strategy" width="800" />
</a>
<p>Source: <a href="https://otelciro.com">OtelCiro</a> — AI Hotel Revenue Management</p>
Guest Satisfaction KPIs
13. Guest Review Score (Composite)
Formula: Weighted average across Google, Booking.com, TripAdvisor Benchmark: Target 8.5+/10 (or 4.3+/5) Why it matters: Directly impacts pricing power, ranking algorithms, and booking conversion.
14. Net Promoter Score (NPS)
Formula: % Promoters (9-10) - % Detractors (0-6) Benchmark: Good: 30-50; Excellent: 50+ Why it matters: Predicts repeat visitation and word-of-mouth referrals.
15. Review Response Rate
Formula: Responses / Total Reviews × 100 Benchmark: Target 100% Why it matters: Impacts Booking.com and Google ranking. Shows future guests you care.
Operational KPIs
16. Labor Cost Percentage
Formula: Total Labor Cost / Total Revenue × 100 Benchmark: Full service: 30-35%; Limited service: 22-28% Why it matters: Typically the largest controllable expense. Small improvements yield significant profit impact.
17. Energy Cost Per Occupied Room
Formula: Total Energy Cost / Rooms Occupied Benchmark: $8-15 per occupied room (varies by climate/property) Why it matters: Energy is the second largest controllable expense. IoT and automation can reduce this by 15-25%.
18. Housekeeping Minutes Per Room
Formula: Total Housekeeping Hours × 60 / Rooms Cleaned Benchmark: Full turnover: 25-35 min; Stay-over: 15-20 min Why it matters: Operational efficiency indicator. Excessive time per room signals training or process issues.
19. Maintenance Response Time
Formula: Average time from work order creation to completion Benchmark: Urgent: <1 hour; Standard: <4 hours Why it matters: Directly impacts guest satisfaction and review scores.
20. Employee Turnover Rate
Formula: Departures / Average Staff Count × 100 Benchmark: Industry average: 60-75% annually (target: below 40%) Why it matters: High turnover increases training costs, reduces service quality, and damages institutional knowledge.
Building Your Dashboard
Recommended Dashboard Structure
Daily view: Occupancy, ADR, RevPAR, pick-up pace, new reviews Weekly view: Channel mix, cancellation rate, response times, labor cost Monthly view: All 20 KPIs with trend lines and comp set comparison Quarterly view: Strategic metrics with year-over-year trends
Visualization Best Practices
- Use traffic light indicators (green/amber/red) for quick status assessment
- Show trends, not just snapshots — a declining 8.5 review score is more concerning than a stable 8.2
- Compare to comp set wherever possible, not just to your own history
- Set alerts for KPIs that breach critical thresholds
Related reading: How Many Hours a Year Does Your Hotel Run Empty? The True Cost of Unsold Rooms
OtelCiro: Your Hotel Intelligence Dashboard
OtelCiro's Reports platform provides a pre-built KPI dashboard that tracks all 20 essential metrics in real time. The system pulls data from your PMS, channel manager, and review platforms to create a unified performance view — no spreadsheet assembly required.
For deeper metric analysis, read our hotel revenue management guide and total revenue management overview.
Conclusion
A hotel KPI dashboard is not a luxury — it is the operating instrument panel that tells you whether your hotel is climbing, cruising, or descending. The 20 metrics outlined in this guide provide a comprehensive view of revenue, demand, distribution, satisfaction, and operations. Start by tracking the five most critical KPIs for your situation, then expand as your measurement culture matures.
Discover how OtelCiro's Reports platform can give you real-time visibility into every metric that matters for your hotel's performance.

![Hotel Upselling: AI-Driven Revenue Growth [2026]](https://cdn.sanity.io/images/1la98t0z/production/9850350573fc466b95b1490c7f689e8ac39c4f11-1200x669.png?w=1920&q=50&auto=format&fit=max)