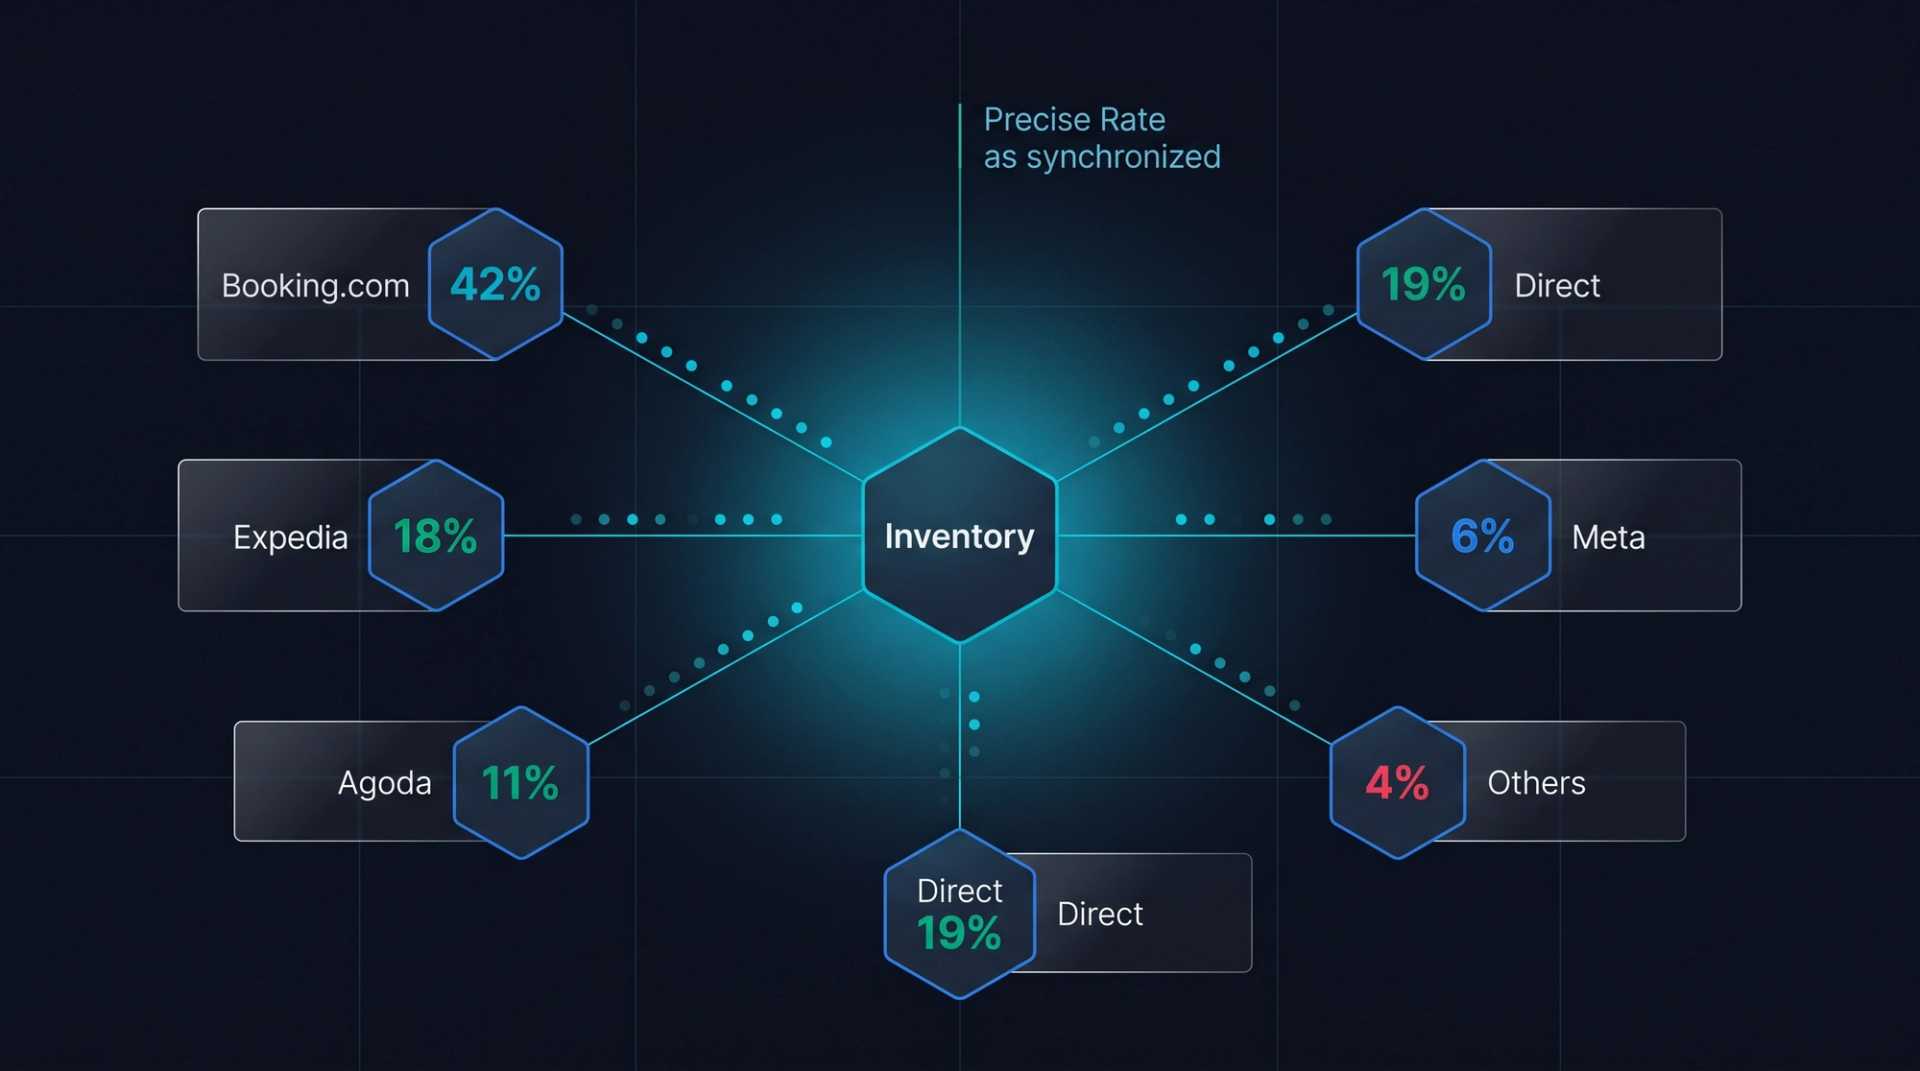
![Hotel F&B Profitability: Cost Control Strategies [2026 Guide]](https://cdn.sanity.io/images/1la98t0z/production/1600b98c4f95941922c096507442e1a5bb827a42-1376x768.jpg?w=1920&q=65&auto=format&fit=max)
Key Takeaways
- The F&B department is the second-largest hotel revenue source (20-40% of total revenue) but operates on narrow net profit margins (5-15%), making meticulous cost control essential.
- Achieving even a 1% reduction in food cost can significantly boost annual profits by ₺50,000-₺150,000 for a 100-room hotel.
- Implement menu engineering, adapted from the BCG Matrix, to categorize and optimize menu items based on their popularity and profitability.
- Strategic waste management, including portion control, FIFO inventory, and buffet optimization, is crucial to reduce food cost by 5-15%.
- Standardized recipes, robust inventory control (Par Stock, FIFO), and comprehensive F&B reporting are foundational for sustained profitability.
F&B Department: Highest Revenue Potential, Most Challenging Cost Control
The Food & Beverage (F&B) department is the hotel's second-largest revenue source after room revenue — it can account for 20-40% of total revenue. However, it also has the lowest profit margin. While the industry average for hotel F&B gross profit margin is 55-65%, the net profit margin typically remains in the 5-15% range.
Food cost control is critical to maintaining and expanding this margin. A 1% reduction in food cost can translate to an additional ₺50,000-₺150,000 in annual profit for a 100-room hotel.

Embed this image on your site
<a href="https://otelciro.com/en/news/hotel-f-b-profitability-cost-control-strategies-2026-guide">
  <img src="https://cdn.sanity.io/images/1la98t0z/production/1600b98c4f95941922c096507442e1a5bb827a42-1376x768.jpg" alt="Hotel F&B cost control and profitability guide infographic" width="800" />
</a>
<p>Source: <a href="https://otelciro.com">OtelCiro</a> — AI Hotel Revenue Management</p>
Related reading: Hotel Preventive Maintenance: Reduce Costs with Preventive Maintenance
Related reading: Hotel Inventory and Stock Management: Digital Control Systems
Food Cost Calculation
Basic Formula
Food Cost % = (Beginning Inventory + Purchases - Ending Inventory) / F&B Revenue x 100
Ideal Food Cost Percentages
| Service Type | Ideal Food Cost | Acceptable Range |
|---|---|---|
| A la carte restaurant | %28-32 | %25-35 |
| Buffet (full board) | %30-35 | %28-38 |
| Breakfast | %22-28 | %20-30 |
| Room service | %25-30 | %22-33 |
| Banquet/event | %25-30 | %22-32 |
| Bar/beverage | %18-22 | %15-25 |
Beverage Cost
Beverage cost is generally lower than food and offers higher profit margins:
- Non-alcoholic beverages: %10-15 cost
- Beer: %20-25 cost
- Wine: %25-35 cost
- Cocktail: %15-20 cost
Embed this image on your site
<a href="https://otelciro.com/en/news/hotel-f-b-profitability-cost-control-strategies-2026-guide">
  <img src="https://cdn.sanity.io/images/1la98t0z/production/a6cfff20a34c3718e20035b84ea27baa69f84127-1200x2150.png" alt="Hotel housekeeping automation system" width="800" />
</a>
<p>Source: <a href="https://otelciro.com">OtelCiro</a> — AI Hotel Revenue Management</p>
Menu Engineering
BCG Matrix Adaptation
Menu engineering optimizes the menu by analyzing the popularity and profitability of each menu item:
| Category | Popularity | Profitability | Strategy |
|---|---|---|---|
| Star | High | High | Maintain, feature prominently |
| Plowhorses | High | Low | Reduce cost or increase price |
| Puzzles | Low | High | Promote better, feature on menu |
| Dogs | Low | Low | Remove from menu |
How to Conduct Menu Analysis?
- Record the sales quantity for each menu item (at least 3 months of data).
- Calculate the food cost for each item.
- Determine the sales contribution margin (selling price - food cost).
- Find the average popularity.
- Find the average profitability.
- Place each item into one of the 4 categories.
- Determine strategic actions.
Menu Pricing
Determine pricing based on the target food cost percentage:
Selling Price = Ingredient Cost / Target Food Cost %
Example: Ingredient cost 80 TL, target food cost %30 → Selling price = 80 / 0.30 = 267 TL
Related reading: Hotel Check-in/Check-out Process Improvement: Eliminate Waiting
Related reading: Hotel Reception Management: Front Office Operations Guide
Waste Management
Waste in hotel kitchens accounts for 5-15% of food cost. Reducing this directly translates to profit.
Types of Waste and Solutions
| Type of Waste | Rate | Solution |
|---|---|---|
| Over-portioning | %3-5 | Standard portion weights |
| Spoilage/expiration | %2-4 | FIFO system, stock rotation |
| Preparation waste | %2-3 | Training, standard cutting |
| Buffet leftovers | %3-5 | Demand forecasting, small container use |
| Order errors | %1-2 | Clear ordering system |
Buffet Waste Reduction
Buffet waste is a major cost in all-inclusive and half-board hotels:
- Demand forecasting — Production quantity based on occupancy and guest profile.
- Small containers — Use small, frequently refreshed containers instead of large platters.
- Live cooking stations — Order-based omelets, pasta, wok dishes (both fresh and less waste).
- Second meal utilization — Creatively re-purpose evening buffet leftovers.
- Weighing for control — Track trends by weighing end-of-day waste.
Embed this image on your site
<a href="https://otelciro.com/en/news/hotel-f-b-profitability-cost-control-strategies-2026-guide">
  <img src="https://cdn.sanity.io/images/1la98t0z/production/94430a233fc50ac1fa33aa6540d2d61c577b51bc-1200x2150.png" alt="Smart PMS hotel management system features" width="800" />
</a>
<p>Source: <a href="https://otelciro.com">OtelCiro</a> — AI Hotel Revenue Management</p>
Inventory Management
FIFO (First In, First Out)
The first product received is the first to be used. This rule minimizes spoilage waste:
- New items go to the back of the shelf.
- Older dated items go to the front.
- Label each product with a date.
Par Stock System
Set minimum and maximum stock levels for each item:
- Par level — The minimum quantity that should always be available.
- Reorder point — Automatic ordering when the par level is reached.
- Avoid overstocking — Reduces tied-up capital and spoilage risk.
Procurement Optimization
- Bulk purchase agreements — Annual contracts with suppliers.
- Seasonal planning — Use seasonal, fresh, and cheaper ingredients.
- Supplier diversity — Mitigate dependency on a single supplier.
- Quality-price balance — Not the cheapest, but the most optimal cost.
Portion Control
Standard Recipe System
Every menu item should have a standard recipe:
- Ingredient list and grammage.
- Preparation steps.
- Presentation photo.
- Portion weight.
- Cost calculation.
This system ensures consistent quality and keeps food costs under control.
Portioning Tools
- Scales (gram precision)
- Standard scoops and spoons
- Portion molds
- Measuring cups
F&B Reporting
Daily Tracking
- Daily F&B revenue (per meal)
- Cover count (revenue per person calculation)
- Inventory movements
- Waste records
Weekly Analysis
- Food cost percentage
- Menu item sales analysis
- Staff productivity (revenue/staff)
- Integrated assessment with revenue metrics
Monthly Report
- Detailed food cost report
- Menu engineering analysis
- Inventory count results
- Supplier price analysis
- Budget vs. actual performance
Related reading: Hotel Energy Management: Smart Solutions for 30% Savings
F&B Revenue Management with OtelCiro
OtelCiro's Smart PMS module integrates F&B revenue and cost data management. Inventory tracking, food cost calculation, menu performance analysis, and waste reporting are all available on a single platform.
Optimize your F&B profitability with OtelCiro Smart PMS
Conclusion
F&B cost control is a critical management area that directly impacts your hotel's profit margin. Hotels that consistently manage these four pillars—menu engineering, waste management, inventory control, and portion standardization—can transform their F&B department into a profit center.
Discover how OtelCiro's Smart PMS can optimize your F&B management processes.
![Europe's Hotel Construction Boom: 2026 Oversupply Risks [Market Analysis]](https://cdn.sanity.io/images/1la98t0z/production/6dfe59137f56aa14bfcba86d9db3cf05ff89f406-2752x1536.jpg?w=1920&q=50&auto=format&fit=max)