![Antalya Tourism Revenue: 2026 Trend Analysis [Strategy Guide]](https://cdn.sanity.io/images/1la98t0z/production/8127e3cd738c39db3439a921c57b9751c986c92d-1200x669.png?w=1920&q=65&auto=format&fit=max)
Key Takeaways
- Antalya's tourism revenue soared to $13.6 billion in 2026, marking a 49.5% growth since 2019, driven by 16.8 million international tourists.
- Average tourist spending increased significantly to $810, with the Middle East market showing the highest per-night expenditure at $1,240.
- The market is shifting towards ultra-all-inclusive concepts (now 38% of preferences) and diversified revenue streams, particularly SPA & wellness, which grew by 22%.
- Antalya's tourism season is extending, reaching 7.5 months in 2026, with winter occupancy rising to 42%, signaling reduced seasonality.
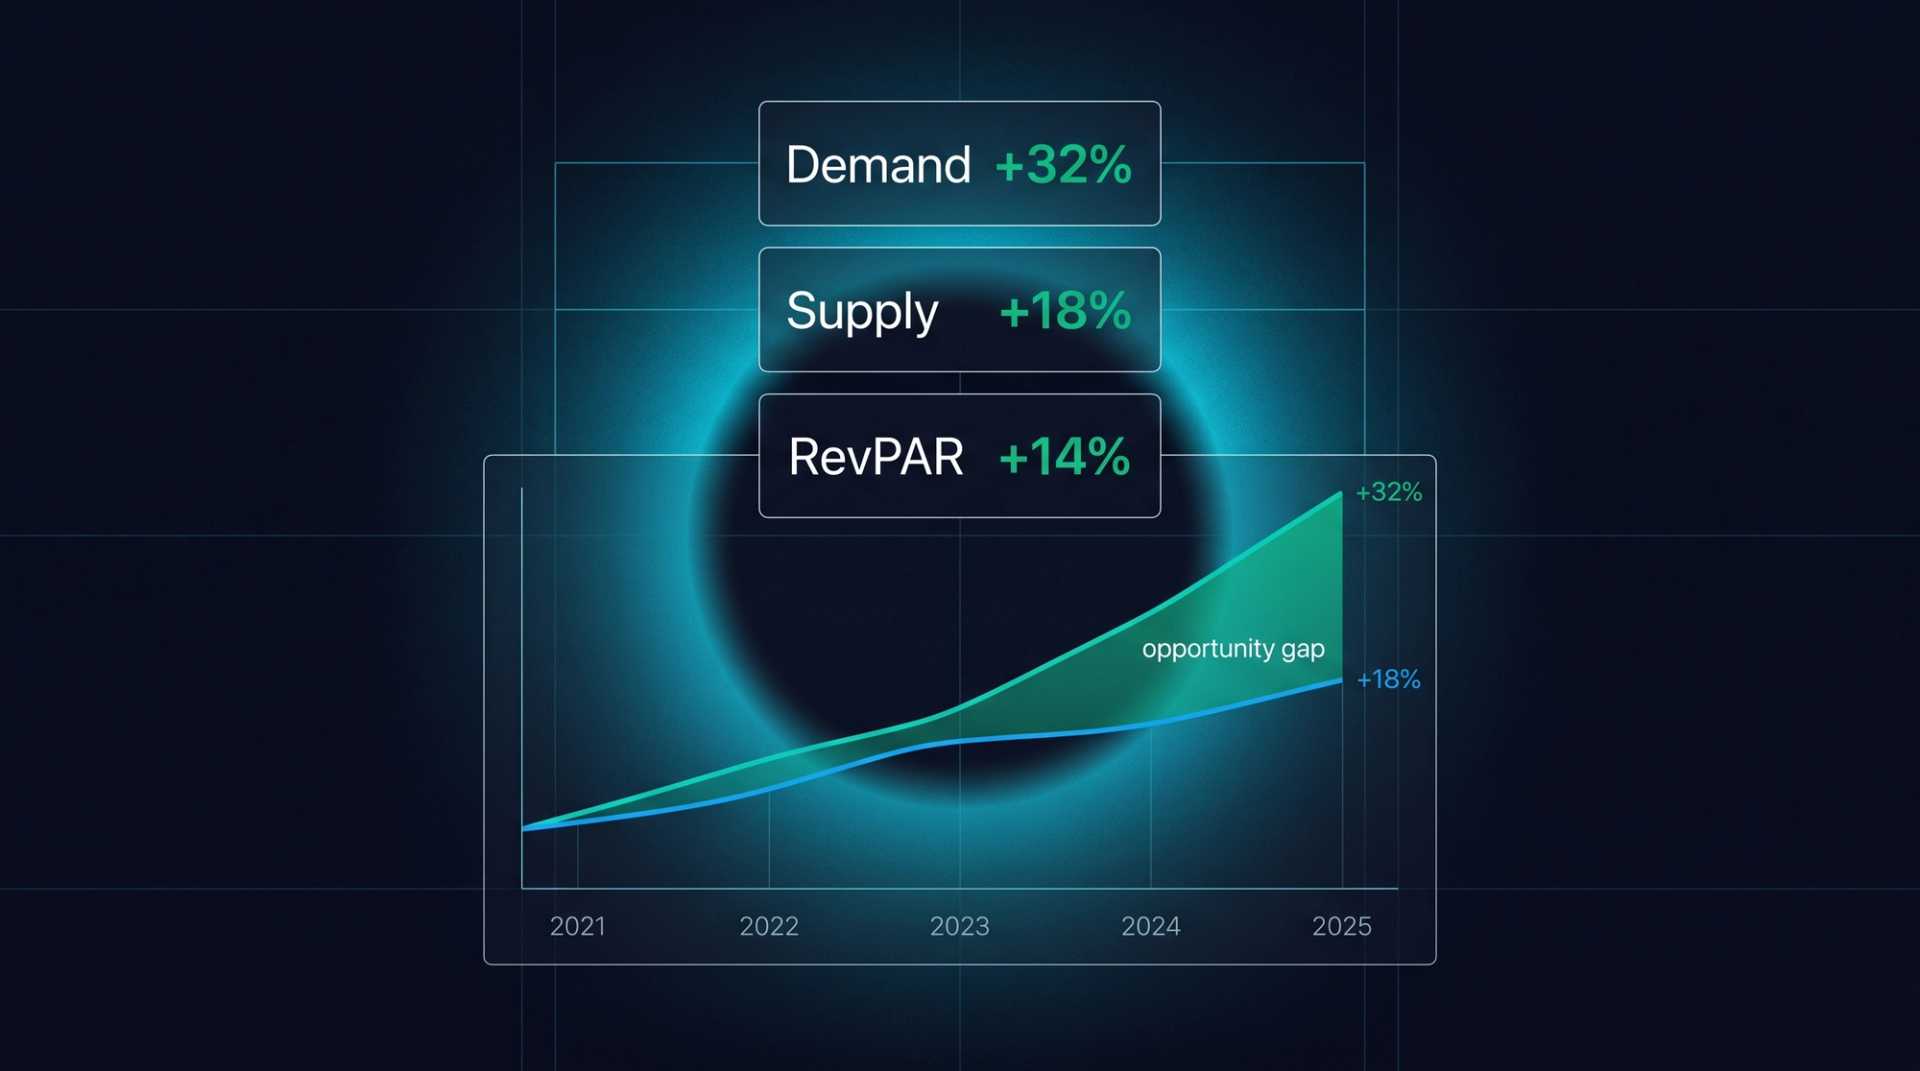
- RevPAR increased by 18% annually, with hotels employing dynamic pricing achieving 24% higher RevPAR compared to those with static pricing.
Antalya: Turkey's Tourism Driving Force
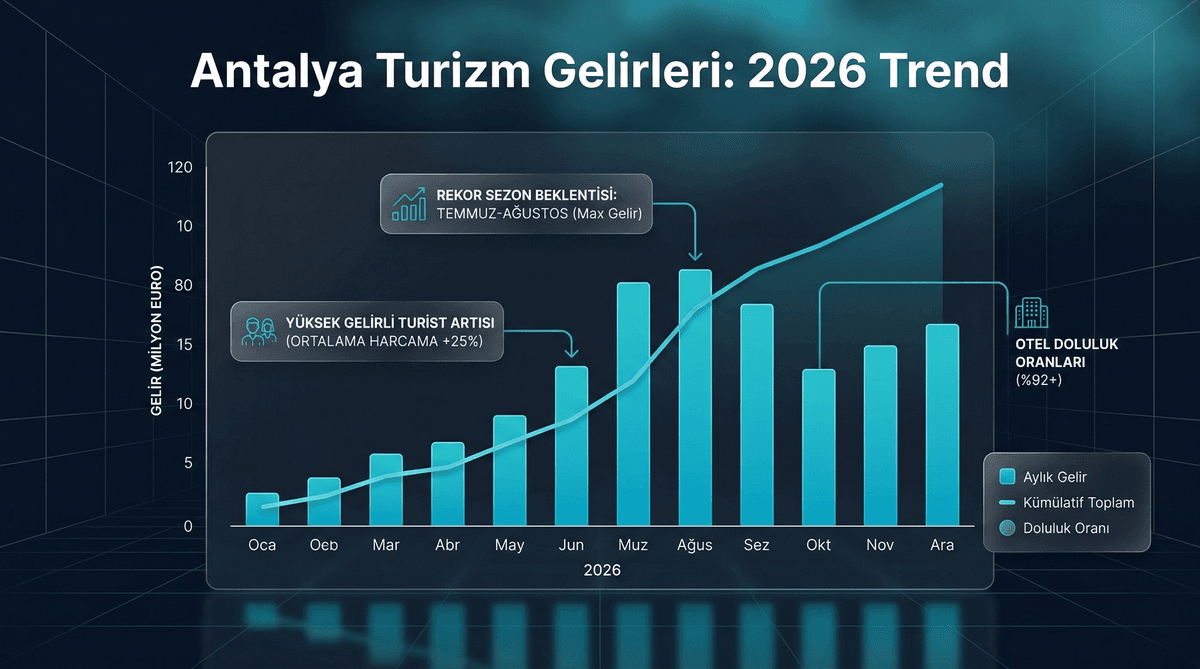
In 2026, Antalya solidified its position as Turkey's largest tourism hub, welcoming 16.8 million international tourists. The city's total tourism revenue reached $13.6 billion, surpassing the total tourism revenue of many European countries on its own. This figure represents a 49.5% growth over five years compared to the $9.1 billion revenue in 2019.
Antalya's success is measured not only by tourist numbers but also by the increase in per-tourist spending. In 2026, the average spending per tourist rose to $810 — up from $620 in 2019. Behind this increase are the rising preference for premium accommodations and the effective use of upselling additional services.
Embed this image on your site
<a href="https://otelciro.com/en/news/antalya-tourism-revenue-2026-trend-analysis-strategy-guide">
  <img src="https://cdn.sanity.io/images/1la98t0z/production/8127e3cd738c39db3439a921c57b9751c986c92d-1200x669.png" alt="Antalya Tourism Revenue Analysis Infographic" width="800" />
</a>
<p>Source: <a href="https://otelciro.com">OtelCiro</a> — AI Hotel Revenue Management</p>
Related reading: Turkey Hotel Market Size 2026: Detailed Analysis
Tourist Profile Shift: Who's Visiting?
Antalya's tourist profile has undergone a radical transformation in the last five years. This shift directly impacts hoteliers' pricing and marketing strategies.
Source Market Analysis
As of 2026, the country-based distribution of tourists visiting Antalya is as follows:
- Russia: 22% (3.7 million tourists). Still the largest source market, but its share has decreased from 30% in 2019.
- Germany: 18% (3.0 million tourists). Steady growth continues.
- United Kingdom: 10% (1.7 million tourists). Post-Brexit recovery is complete.
- Poland and Eastern Europe: 12% (2.0 million tourists). The fastest-growing segment.
- Middle East (Gulf countries): 8% (1.3 million tourists). High spending capacity.
- Other markets: 30% (5.1 million tourists). Diversification strategy is yielding results.
A noteworthy trend is the Middle East market leading in per-tourist spending. Tourists from Gulf countries have an average nightly spend of $1,240, almost double the overall average.
Accommodation Preference Shift
The all-inclusive concept continues to be Antalya's primary sales model. However, proportions are changing:
- Ultra all-inclusive: 38% (2019: 28%) — demand for premium concepts is increasing.
- All-inclusive (standard): 34% (2019: 45%) — there is a shift away from the traditional model.
- Half board and bed & breakfast: 18% (2019: 17%) — on the rise with boutique hotel preferences.
- Room only: 10% (2019: 10%) — city hotels and apartment concepts.
This data indicates that investing in ultra-premium concepts is critical for Antalya hoteliers in terms of revenue maximization.
Revenue Streams and Distribution
The revenue structure of Antalya hotels has undergone significant diversification in recent years. While accommodation revenue remains the main item, additional income sources are increasing their share of total revenue.
2026 Antalya hotel revenue distribution:
| Revenue Stream | Share | Annual Growth |
|---|---|---|
| Accommodation revenue | 52% | +12% |
| Food & Beverage | 24% | +8% |
| SPA & Wellness | 9% | +22% |
| Sports & Activities | 6% | +18% |
| Other (transfer, tour, shopping) | 9% | +15% |
The 22% growth in SPA and wellness revenues is remarkable. With the strengthening trends in health tourism and wellbeing, this category is expected to reach 12-15% of total revenue in the coming years.
AI-powered reporting tools analyze these revenue streams in real time, enabling hoteliers to make data-driven decisions on where to invest.
Related reading: Hotel TRevPAR: Maximize Your Profit with Total Revenue Management
Seasonal Dynamics and Pricing
The most prominent characteristic of Antalya tourism is its strong seasonality. However, in recent years, this seasonality has shown a decreasing trend — which is a highly positive development for the industry.
Changes in Season Length
- 2019: Active season 5 months (May-September). Winter occupancy rate: 25%.
- 2023: Active season 6.5 months (April-mid-October). Winter occupancy rate: 35%.
- 2026: Active season 7.5 months (April-mid-November). Winter occupancy rate: 42%.
Several factors are behind the extended season: long-term stays by digital nomads, year-round health and wellness tourism, and increased flight connections at Antalya Airport during the winter season.
Pricing Metrics
2026 Antalya general pricing metrics:
- Average ADR (annual): $142 (+15% annual increase)
- Summer season ADR: $198
- Winter season ADR: $78
- Average occupancy rate: 71%
- RevPAR (annual): $101 (+18% annual increase)
The 18% increase in RevPAR is a result of both price increases and occupancy improvements. Hotels using dynamic pricing have RevPARs 24% higher than those applying static pricing — this difference clearly demonstrates the direct impact of technology adaptation on revenue.
Sub-Region Comparison
Different regions within Antalya province are exhibiting varying performances:
Belek: ADR leader (average $225). This region caters to the highest-spending segment with golf tourism and premium resort concepts. Occupancy rate 74%.
Kemer: Best position in price-performance balance (ADR $115, occupancy 76%). The strongest region for the Russian market.
Lara-Kundu: Rapidly growing region with new investments (ADR $155, occupancy 69%). The hub for ultra-all-inclusive concepts.
Alanya: Volume leader — highest room count and longest season. ADR is relatively low ($88) but compensated by volume. Occupancy 72%.
Kaş-Kalkan: Turkey's most premium destination for boutique hotel management (ADR $310, occupancy 62%). A low-volume, high-value strategy.
2026-2028 Projections
Antalya's tourism revenue is expected to reach $17 billion by 2028. The main factors supporting this growth are:
- Antalya Airport new terminal: Expansion planned for completion in 2027 will increase annual capacity to 80 million passengers.
- Health tourism investments: Strengthening thermal and medical tourism infrastructure.
- Digital transformation: Widespread adoption of AI-powered revenue management and personalization technologies.
- Sustainability certifications: Impact of green hotel certifications in the European market.
![Europe's Hotel Construction Boom: 2026 Oversupply Risks [Market Analysis]](https://cdn.sanity.io/images/1la98t0z/production/6dfe59137f56aa14bfcba86d9db3cf05ff89f406-2752x1536.jpg?w=1920&q=50&auto=format&fit=max)