![Strategic Food Cost Control for Hotel F&B [2025 Guide]](https://cdn.sanity.io/images/1la98t0z/production/21d4f89bf7dd355f38aa0f32dc0d8015ed7ce9a9-1200x669.png?w=1920&q=65&auto=format&fit=max)
Key Takeaways
- Target Optimal Food Cost: Aim for a 28-32% food cost percentage; a 5-6% improvement can translate to an additional 800,000-1,200,000 TL in annual profit for a 200-room hotel.
- Monitor Theoretical vs. Actual Costs: Track both theoretical (recipe-based) and actual (inventory-based) food costs. A difference exceeding 2-3% indicates significant operational losses requiring immediate action.
- Standardize and Control Portions: Implement detailed recipe cards with gram-based measurements and utilize standard portioning tools to reduce cost discrepancies by 15-25% and achieve 3-5% savings per portion.
- Optimize Supply Chain and Inventory: Adopt a multi-supplier strategy, conduct weekly price comparisons, and utilize FIFO and par stock systems to achieve 10-18% savings and minimize waste.
- Leverage Menu Engineering & Technology: Analyze menu items by popularity and profitability to increase F&B profitability by 12-20%. Use digital F&B management systems for real-time tracking and automated costing.
Cost Realities in Hotel F&B Departments
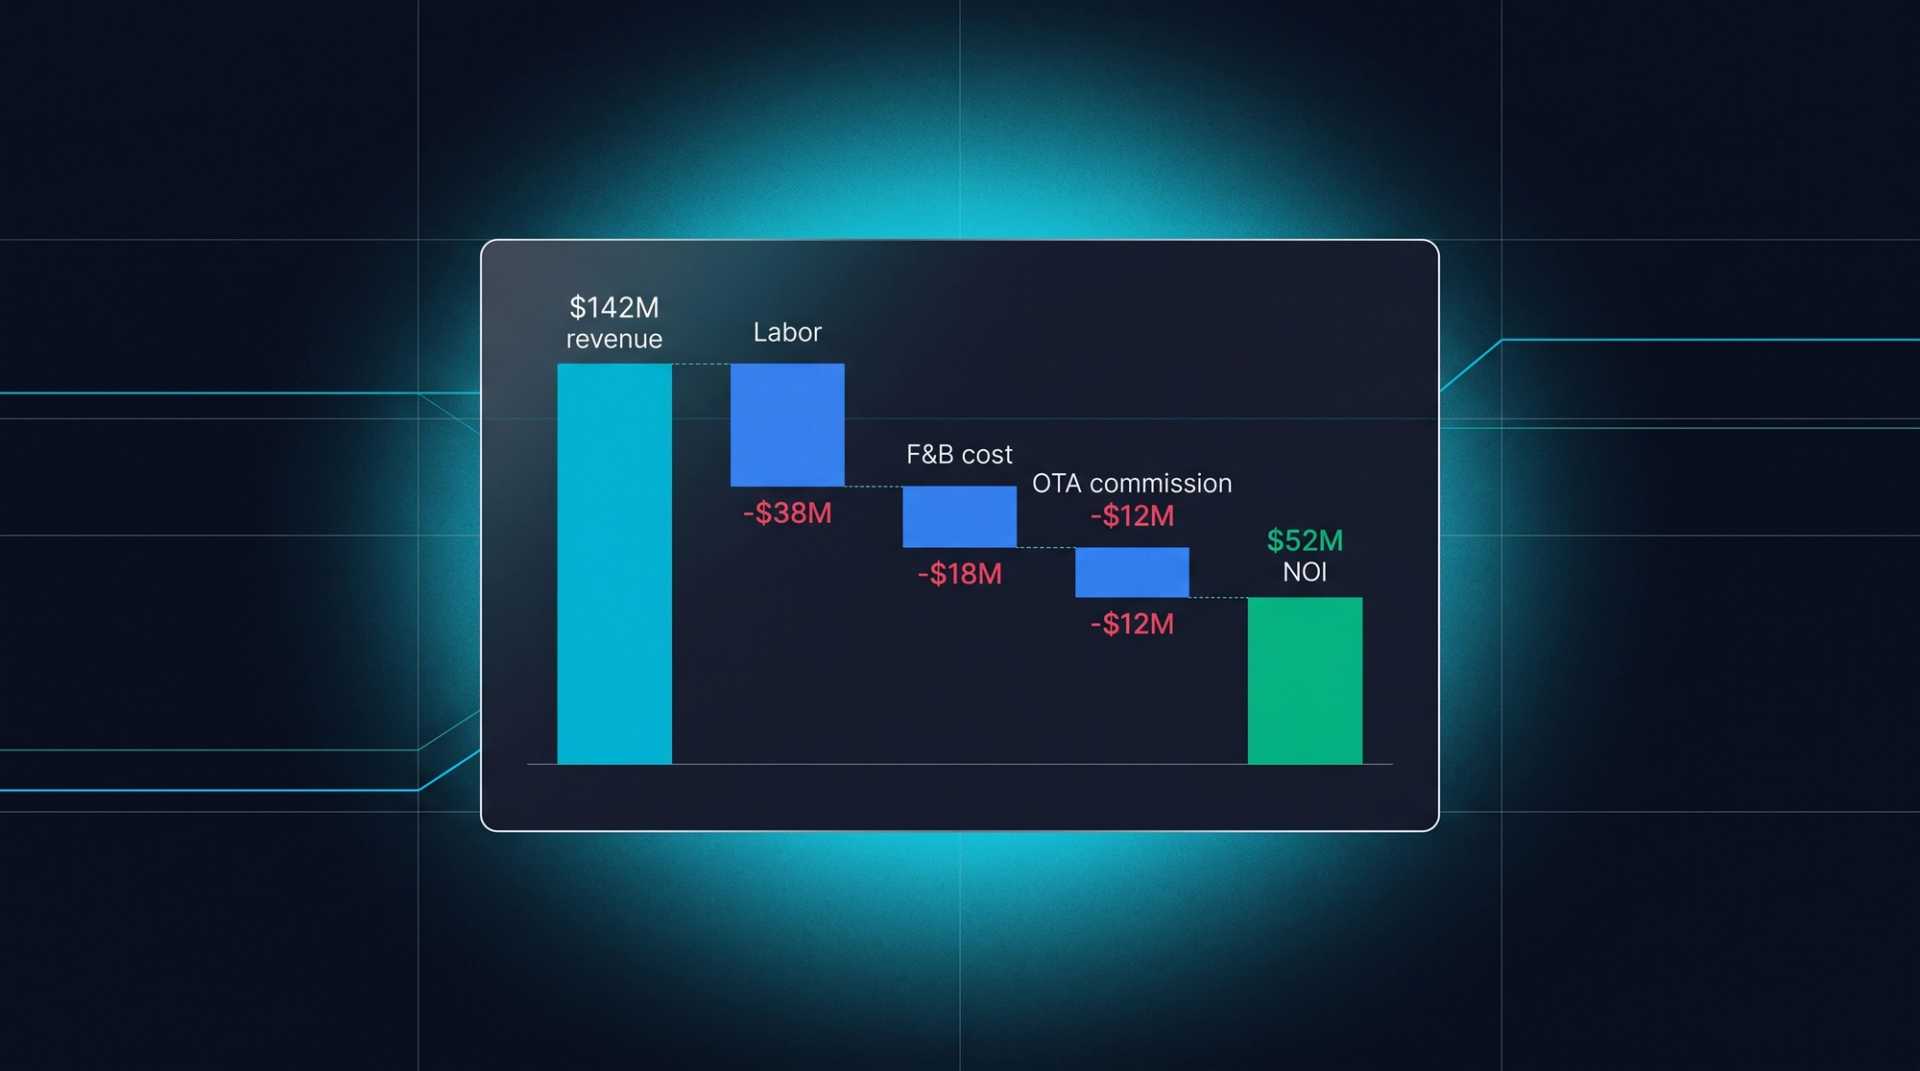
The Food & Beverage (F&B) department typically accounts for an average of 25-35% of hotel revenues, yet it is also the segment most susceptible to cost pressures. While the average food cost percentage in Turkish hotels hovers around 33-38%, the international standard target range is 28-32%. This 5-6 percentage point difference can translate into an additional 800,000-1,200,000 TL in annual profit for a 200-room hotel.
Given that food inflation is projected to reach 42% in Turkey by 2025, the importance of robust cost control mechanisms is heightened. Directly passing price increases onto menu items can reduce guest satisfaction, while absorbing them jeopardizes profitability. The solution lies in systematic food cost management.
Related reading: Cost Per Occupied Room Analysis: CPOR Calculation
How to Calculate Food Cost Percentage
Two primary approaches are used to calculate food cost percentage:
Theoretical Food Cost
Theoretical cost represents the ideal raw material cost per portion based on recipe cards:
Theoretical Food Cost (%) = (Total Raw Material Cost Based on Recipes / Total F&B Revenue) x 100
This ratio answers the question: "What would our cost be if there were no waste, loss, or theft?" It should typically range between 22-26%.
Actual Food Cost
Actual cost is the real consumption cost, calculated using the formula: beginning inventory + purchases - ending inventory:
Actual Food Cost (%) = (Beginning Inventory + Purchases - Ending Inventory) / Total F&B Revenue x 100
The difference between theoretical and actual cost indicates the operational loss rate. If this difference exceeds 2-3 percentage points, it signals a serious lack of control. According to industry data, 65% of Turkish hotels have a difference exceeding 4 percentage points, indicating significant potential for improvement.
Portion Control and Standardization
Portion control is one of the most effective tools for food cost management. In kitchens without standard portioning practices, cost deviation can range from 15-25%.
Recipe Card System
It is mandatory for every menu item to have a detailed recipe card. An effective recipe card includes:
- Gram-based quantity for each raw material
- Unit cost and total cost of raw materials
- Preparation and cooking procedures
- Photo of the portion (presentation standard)
- Waste and trim rates
- Alternative raw material options
Research shows that hotels implementing a digital recipe card system reduce food costs by 8-12%. With the OtelCiro reporting system, you can track your F&B cost ratios daily and instantly detect deviations.
Portioning Tools
The use of standard portioning tools significantly reduces costs:
- Digital scales: Gram-based scales at every preparation station
- Standard scoops and spoons: Numbered portioning tools
- Portion molds: Especially for cold kitchens and patisseries
- Automatic dispensers: For items like sauces, butter, and jam
Full implementation of these tools can reduce portion-based cost deviation by 3-5%.
Supply Chain and Purchasing Optimization
The purchasing process plays a critical role in food cost control. A correct procurement strategy can achieve 10-18% savings in raw material costs.
Supplier Management
Effective supplier management involves the following steps:
- Multiple supplier strategy: At least 2-3 alternative suppliers for each main item
- Weekly price comparison: Regular checking of prices from different suppliers for the same product
- Seasonal contracts: Bulk purchasing agreements based on annual consumption forecasts
- Local supplier network: Direct collaboration with local farmers and producers, especially for fresh produce
72% of Turkish hotels still rely on a single supplier. This reduces both bargaining power and creates supply risk.
Inventory Management
Effective inventory management minimizes food waste and tied-up capital:
- FIFO (First In, First Out): Managing expiry dates using the "first in, first out" principle
- Par stock system: Setting minimum and maximum stock levels for each item
- Weekly count: Weekly physical inventory for high-cost items (meat, seafood, imported products)
- ABC analysis: Classifying items by cost impact as A (high), B (medium), C (low)
In ABC analysis, A-group items (typically 15-20% of total items) account for 70-80% of the cost volume. Focusing on this group yields the highest returns.
Related reading: Supplier Negotiation and Purchasing Optimization
Boosting Profitability with Menu Engineering
Menu engineering is the process of optimizing menu structure by evaluating each menu item based on popularity and profitability. This analysis reveals four categories:
Stars (High popularity + High profitability): Should be highlighted on the menu, price maintained, and presentation perfected. These items should generate 35-45% of revenue.
Puzzles (Low popularity + High profitability): Should be recommended by waiters, better positioned on the menu, and have enhanced visual presentations.
Plowhorses (High popularity + Low profitability): Portion sizes should be optimized, lower-cost garnishes used, and prices gradually increased.
Dogs (Low popularity + Low profitability): Should be removed from the menu or completely redesigned.
F&B profitability reportedly increases by 12-20% after implementing menu engineering. Repeating this analysis quarterly is crucial for adapting to dynamic market conditions.
Breakfast Buffet Cost Control
The vast majority of hotels in Turkey offer open buffet breakfast, which is one of the most critical items in F&B costs. The average per-person breakfast cost ranges between 65-110 TL.
To control breakfast costs:
- Occupancy-based production planning: Determining daily production quantities based on AI-supported occupancy forecasts
- Live cooking stations: An approach that reduces waste by 25-35% while enhancing the guest experience
- Small container strategy: Using frequently refilled small containers instead of large plates
- Time-sliced presentation: Full presentation during peak hours, reduced presentation during quieter times
- Leftover utilization: Using leftover breakfast items in the lunch menu
Holistic application of these strategies can achieve a 15-22% reduction in per-person breakfast costs.
F&B Cost Tracking with Technology
Manual cost tracking is both time-consuming and prone to errors. With digital F&B management tools, you can achieve:
- Real-time cost percentage tracking: Daily, weekly, and monthly cost reports
- Automated recipe costing: Automatic updating of all recipe costs when raw material prices change
- Waste recording and analysis: Documenting where, how much, and why waste occurs
- Supplier performance scoring: Automated scoring based on price, quality, and delivery reliability
OtelCiro's reporting module provides F&B cost ratios alongside other operational metrics in an integrated dashboard, enabling managers to make quick, data-driven decisions.
In conclusion, maintaining the food cost percentage within the target range is not a one-time project but an ongoing discipline. Hotels that consistently apply recipe standardization, portion control, supply optimization, and menu engineering transform their F&B departments from cost centers into profit centers.
![US Hotel Labor Costs Hit $131 Billion in 2026: AI Automation Strategies That Cut Costs Fast [2026 Guide]](https://cdn.sanity.io/images/1la98t0z/production/6765e31b08a1c04cce66f9bf9482693dbefdcce5-2752x1536.jpg?w=1920&q=50&auto=format&fit=max)