![Hotel Tech Investment ROI: A Framework for Decision-Making [2026 Guide]](https://cdn.sanity.io/images/1la98t0z/production/f0d3baf907a68f1bea19877807e4aff64fec5f62-1024x1024.png?w=1920&q=65&auto=format&fit=max)
Key Takeaways
- Tech-forward hotels achieve 18-28% higher RevPAR compared to those relying on legacy systems or manual processes.
- A comprehensive ROI analysis must evaluate four pillars: direct revenue, cost reduction, indirect impact, and risk mitigation.
- Revenue Management Systems (RMS) typically offer the highest returns, with a 3-year ROI ranging from 400% to 800%.
- Total Cost of Ownership (TCO) should account for hidden expenses like staff training, integration, and opportunity costs, not just license fees.
- Prioritizing "Quick Wins" like RMS and Channel Managers provides the fastest payback period, often within 3-6 months.
Why Hotel Technology Investment is Unique
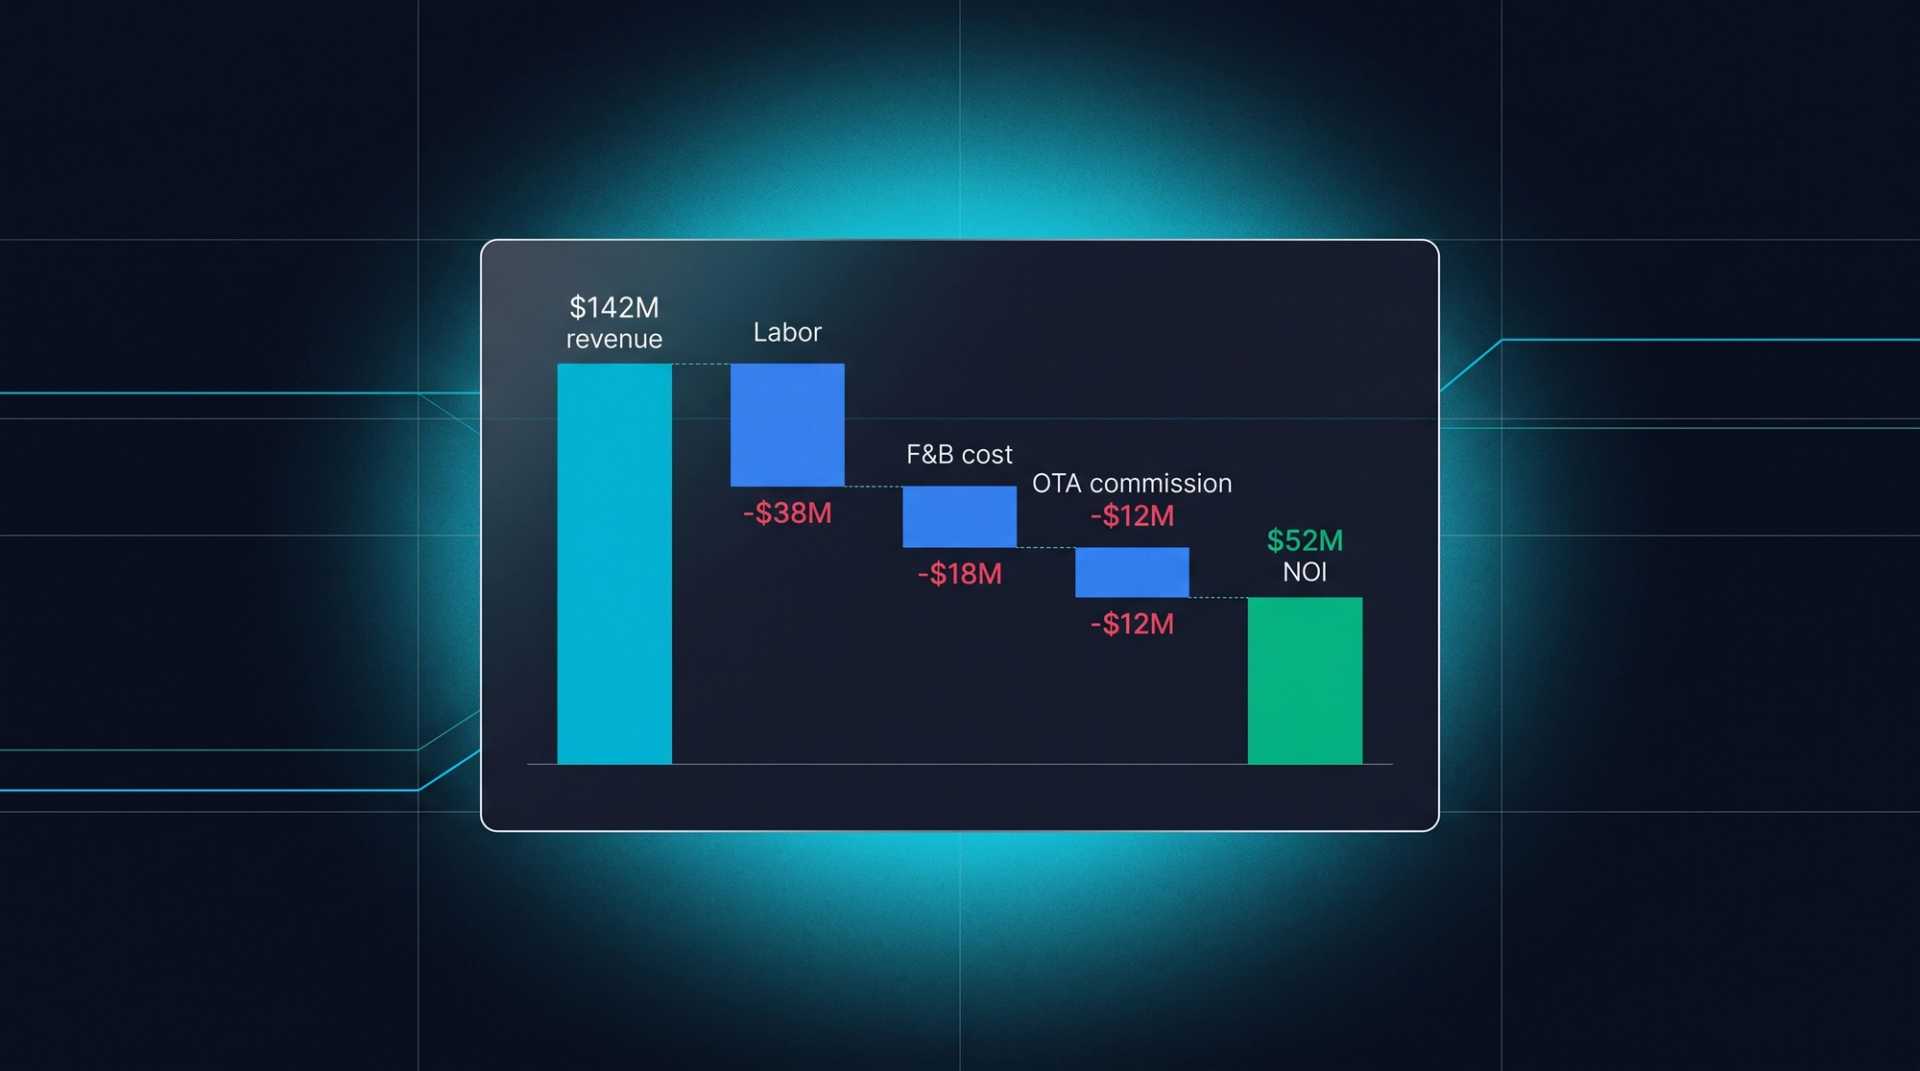
Hotel technology investments differ significantly from other industries. While the return on an automation investment in a manufacturing plant can be measured directly by production increases, hotel technology ROI manifests across multiple dimensions: revenue growth, cost reduction, guest satisfaction, and operational efficiency.
According to 2025 research by Phocuswright, hotel technology spending averages 3.5-5.5% of total revenue. However, evidence shows that increasing this ratio to the 4-6% range effectively self-finances through significant revenue gains. Hotels that make the right technology investments achieve 18-28% higher RevPAR compared to those that do not.
The problem is clear: 67% of hotel managers make technology investment decisions based on intuition or by mimicking competitors, while only 18% perform a systematic ROI analysis. This leads to misplaced investments and inefficient use of resources.
Related reading: Hotel Working Capital Management: Optimizing the Cash Cycle
The ROI Calculation Framework
A comprehensive ROI framework for hotel tech investments evaluates four primary return categories:
1. Direct Revenue Impact
The direct contribution of technology to revenue growth:
- Pricing Optimization: ADR increases of 8-18% through an RMS (Revenue Management System).
- Occupancy Gains: Expanding reach by 5-12% via Channel Managers and booking engines.
- Upselling Revenue: Generating 3-7% in additional revenue through digital upselling tools for room upgrades and ancillary services.
- Direct Booking Growth: Reducing OTA dependency by 10-25% through website optimization and CRM tools.
The aggregate effect of these items represents the most measurable return on technology investment.
2. Cost Reduction
The impact of technology on lowering operational expenses:
- Labor Efficiency: Reducing staffing needs or overtime by 8-15% through automation.
- Energy Savings: Achieving 20-35% savings via smart building management systems.
- Paper and Printing: Lowering physical material costs by 60-80% through digitalization.
- Error Costs: Reducing manual process errors (overbooking, pricing mistakes) by 40-70%.
3. Indirect Revenue Impact
Valuable effects that are more difficult to measure but critical for long-term success:
- Guest Satisfaction Increases: Higher review scores and improved repeat guest rates.
- Brand Perception: The premium image of a hotel utilizing modern technology.
- Staff Satisfaction: Better service delivery from employees equipped with efficient tools.
- Data Value: The contribution of collected guest data to future marketing and operations.
4. Risk Mitigation
The impact of technology on minimizing operational risks:
- Data Security: Preventing the massive costs of data breaches through cybersecurity investment.
- Legal Compliance: Reducing the cost of compliance with regulations like e-invoice mandates and KVKK (Personal Data Protection Law).
- Business Continuity: Ensuring uninterrupted operations through cloud-based systems.
- Market Adaptation: The ability of a flexible tech infrastructure to adapt quickly to changing conditions.
Technology Categories and ROI Benchmarks
Each technology category offers a different ROI profile. Here are the current benchmarks for the Turkish market:
PMS (Property Management System)
| Parameter | Value |
|---|---|
| Average annual cost | 48,000-120,000 TL |
| Expected efficiency gain | 15-25% |
| Payback period | 6-12 months |
| 3-year ROI | 180-350% |
78% of hotels that migrated to a cloud-based PMS achieved a return on investment within the first year.
RMS (Revenue Management System)
| Parameter | Value |
|---|---|
| Average annual cost | 36.000-96.000 TL |
| Expected RevPAR increase | 8-18% |
| Payback period | 3-6 months |
| 3-year ROI | 400-800% |
RMS generally offers the highest ROI among hotel technologies. OtelCiro’s AI-powered revenue management platform delivers returns above the industry average in this category.
Channel Manager
| Parameter | Value |
|---|---|
| Average annual cost | 18,000-48,000 TL |
| Expected occupancy increase | 5-12% |
| Payback period | 2-4 months |
| 3-year ROI | 300-600% |
Booking Engine (Direct Bookings)
| Parameter | Value |
|---|---|
| Average annual cost | 12,000-36,000 TL |
| Direct booking increase | 10-25% |
| OTA commission savings | 15-22% (on shifted bookings) |
| Payback period | 4-8 months |
| 3-year ROI | 250-500% |
CRM and Marketing Automation
| Parameter | Value |
|---|---|
| Average annual cost | 24,000-72,000 TL |
| Repeat booking increase | 12-20% |
| Marketing efficiency gain | 25-40% |
| Payback period | 6-12 months |
| 3-year ROI | 200-400% |
Related reading: Debt Service Coverage Ratio: A Key Indicator of Hotel Financial Health
Investment Prioritization Matrix
To create maximum impact with a limited budget, technology investments must be prioritized along two axes:
Axis 1 - Impact Magnitude: The potential for revenue growth and cost reduction. Axis 2 - Ease of Implementation: Setup time, integration complexity, and staff adaptation.
Based on this matrix, the recommended investment sequence is:
Priority 1 (Immediate): RMS, Channel Manager — High impact, easy implementation, fast payback. Priority 2 (3-6 Months): Cloud PMS, Booking Engine — High impact, moderate implementation complexity. Priority 3 (6-12 Months): CRM, Self check-in, Smart room controls — Moderate impact, moderate implementation. Priority 4 (12-24 Months): AI concierge, IoT sensors, Full automation — High potential, complex implementation.
TCO (Total Cost of Ownership) Analysis
When calculating ROI, it is critical to consider the Total Cost of Ownership (TCO), not just the licensing fee:
- License/Subscription Fees: Monthly or annual software costs (40-50%).
- Setup and Integration: Initial configuration, data migration, and integration with existing systems (15-25%).
- Training: Costs associated with staff training and the adaptation process (5-10%).
- Support and Maintenance: Technical support, updates, and troubleshooting (10-15%).
- Infrastructure: Requirements for hardware, internet, and security (5-15%).
- Opportunity Cost: Productivity loss during the transition period (5-10%).
Cloud-based solutions typically reduce TCO by 30-45% compared to on-premise systems, while offering significant advantages in scalability and updates.
ROI Tracking and Evaluation
Post-investment ROI tracking is essential to guide future decision-making:
First 90 Days: Establish baseline values for key metrics and track technology adoption rates. Goal: 80%+ active usage by relevant staff.
6-Month Evaluation: Measure the first tangible results. Compare KPIs such as RevPAR, occupancy, and cost ratios against pre-investment data.
Annual ROI Report: Conduct a comprehensive analysis of the total financial impact. Aggregate direct and indirect returns and compare them against the TCO.
The OtelCiro platform provides all these metrics in an integrated dashboard, allowing you to transparently track the real return on your technology investments.
In conclusion, hotel technology investment should be a data-driven process rather than an intuitive decision. Investments made using a systematic ROI framework, TCO analysis, and a prioritization matrix ensure both short-term recovery and long-term competitive advantage.
![US Hotel Labor Costs Hit $131 Billion in 2026: AI Automation Strategies That Cut Costs Fast [2026 Guide]](https://cdn.sanity.io/images/1la98t0z/production/6765e31b08a1c04cce66f9bf9482693dbefdcce5-2752x1536.jpg?w=1920&q=50&auto=format&fit=max)