Key Takeaways
- US hotel labor costs reached $131 billion in 2026, up 3.1% from $127B in 2025, with per-room labor costs climbing 26.3% since 2021 to $35,100 annually.
- Labor now accounts for 52% of total hotel operating expenses — more than energy, technology, and F&B combined — and 78% of GMs cite it as their top financial concern.
- 115,000 unfilled positions persist across the US hotel sector, with housekeeping vacancy rates at 18.4% and average fill times stretching to 47 days.
- 61% of US hotels have deployed at least one AI automation solution in 2026, up from just 23% in 2023 — with chatbots delivering ROI in as little as 3 months.
- A 200-room hotel can generate $90,000+ in annual value from a single AI chatbot deployment, covering front desk call reduction, booking conversion uplift, and repeat-stay revenue.
Embed this image on your site
<a href="https://otelciro.com/en/news/abd-otel-isgucu-maliyeti-131-milyar-2026">
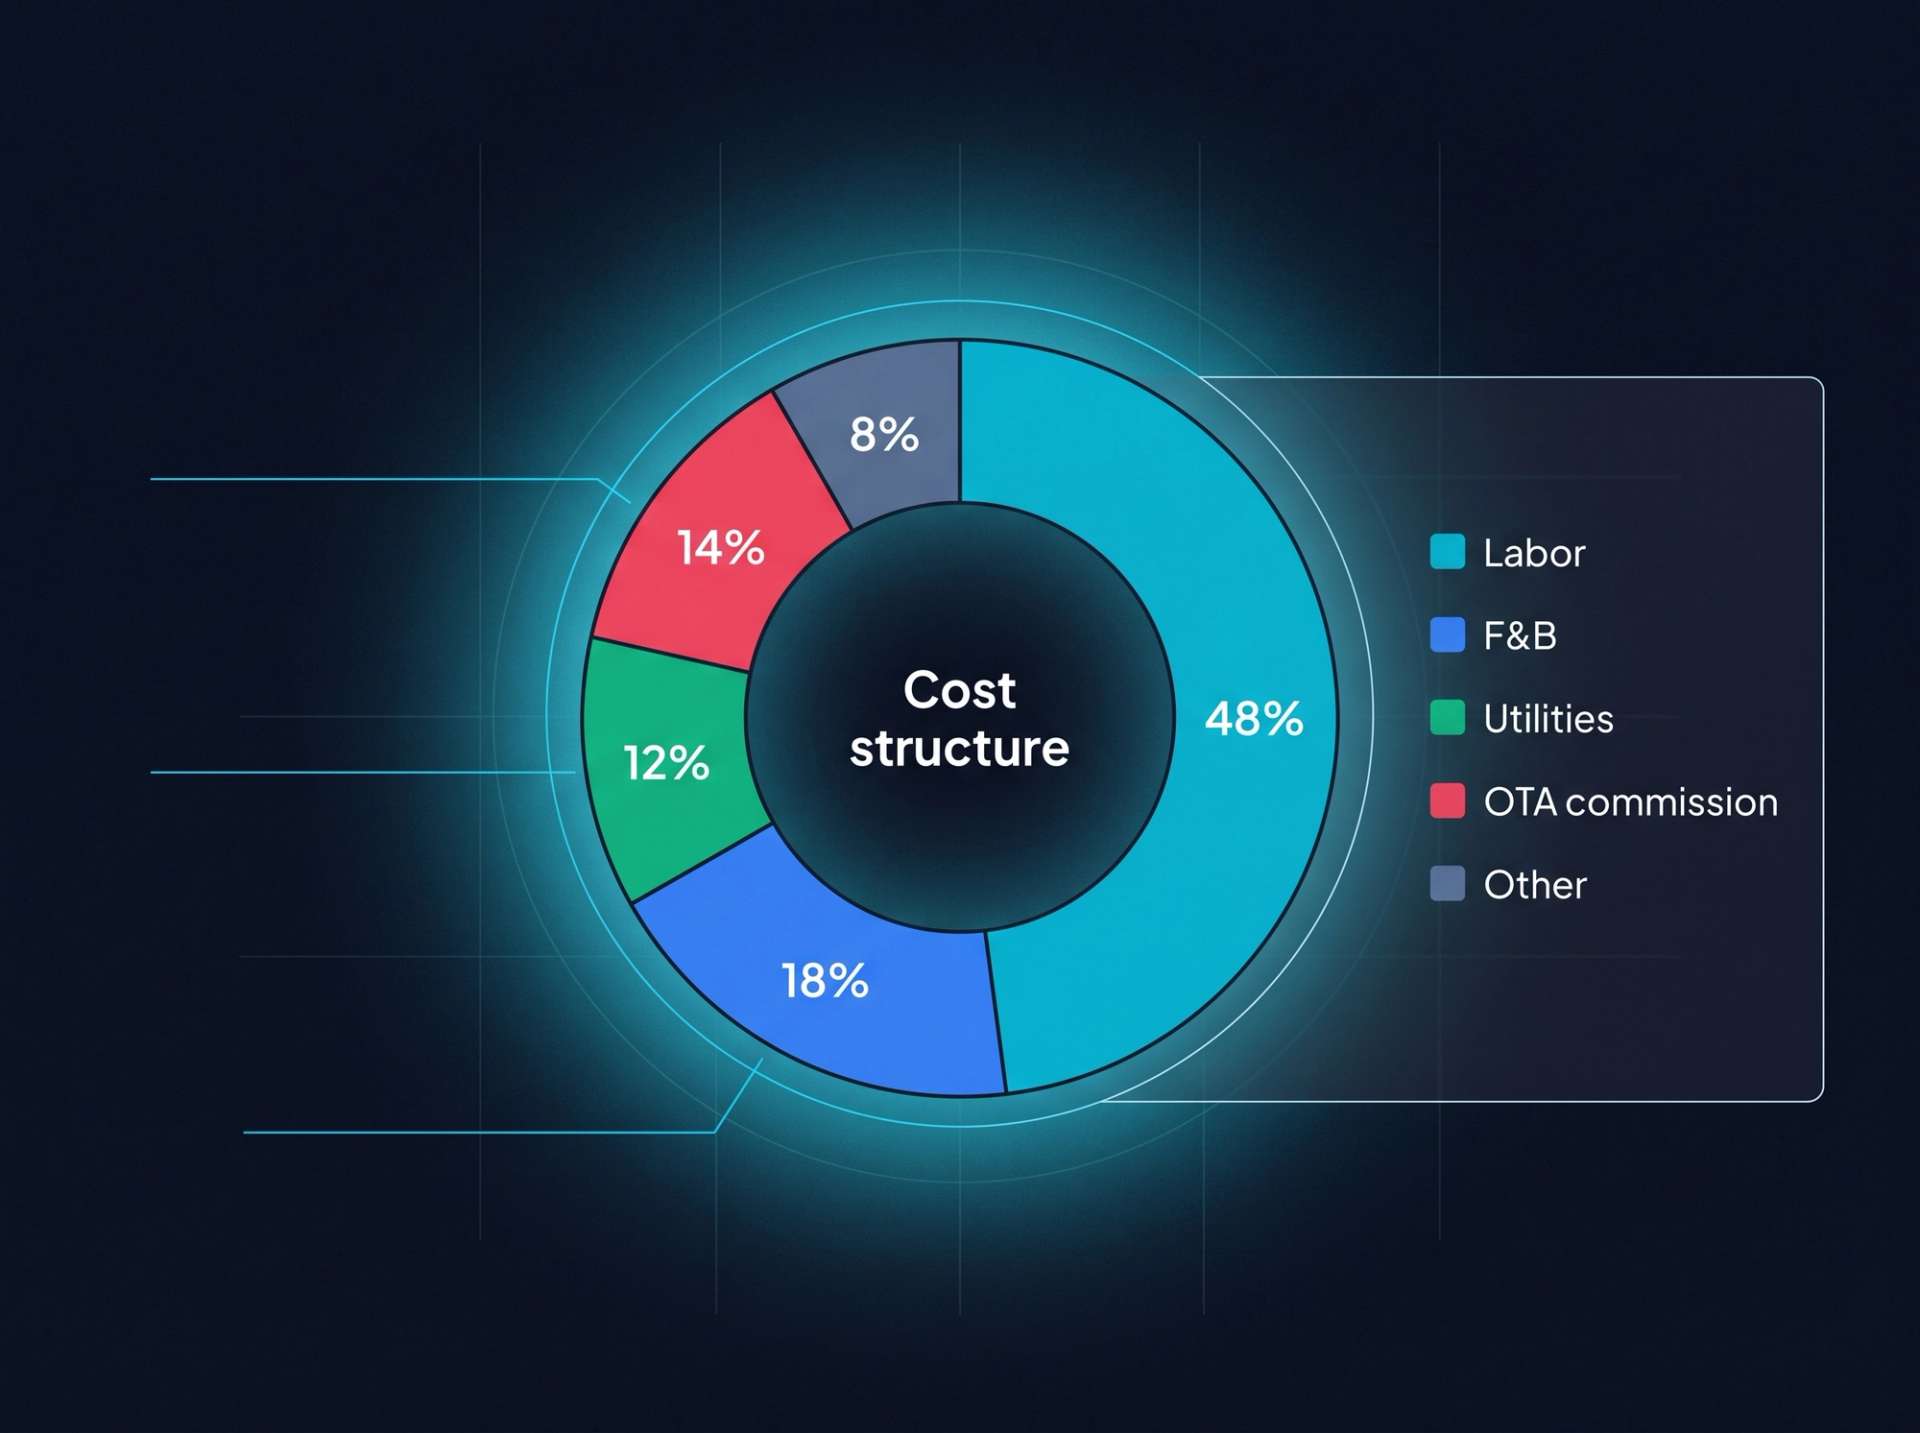
<img src="https://cdn.sanity.io/images/1la98t0z/production/adbf9b76acf82a70904e30d9ac9803c3672aad97-2400x1792.jpg" alt="Cost donut. Labor 48% cyan, F&B 18% blue, Utilities 12% emerald, OTA commission 14% rose, Other 8% muted slate." width="800" />
</a>
<p>Source: <a href="https://otelciro.com">OtelCiro</a> — AI Hotel Revenue Management</p>
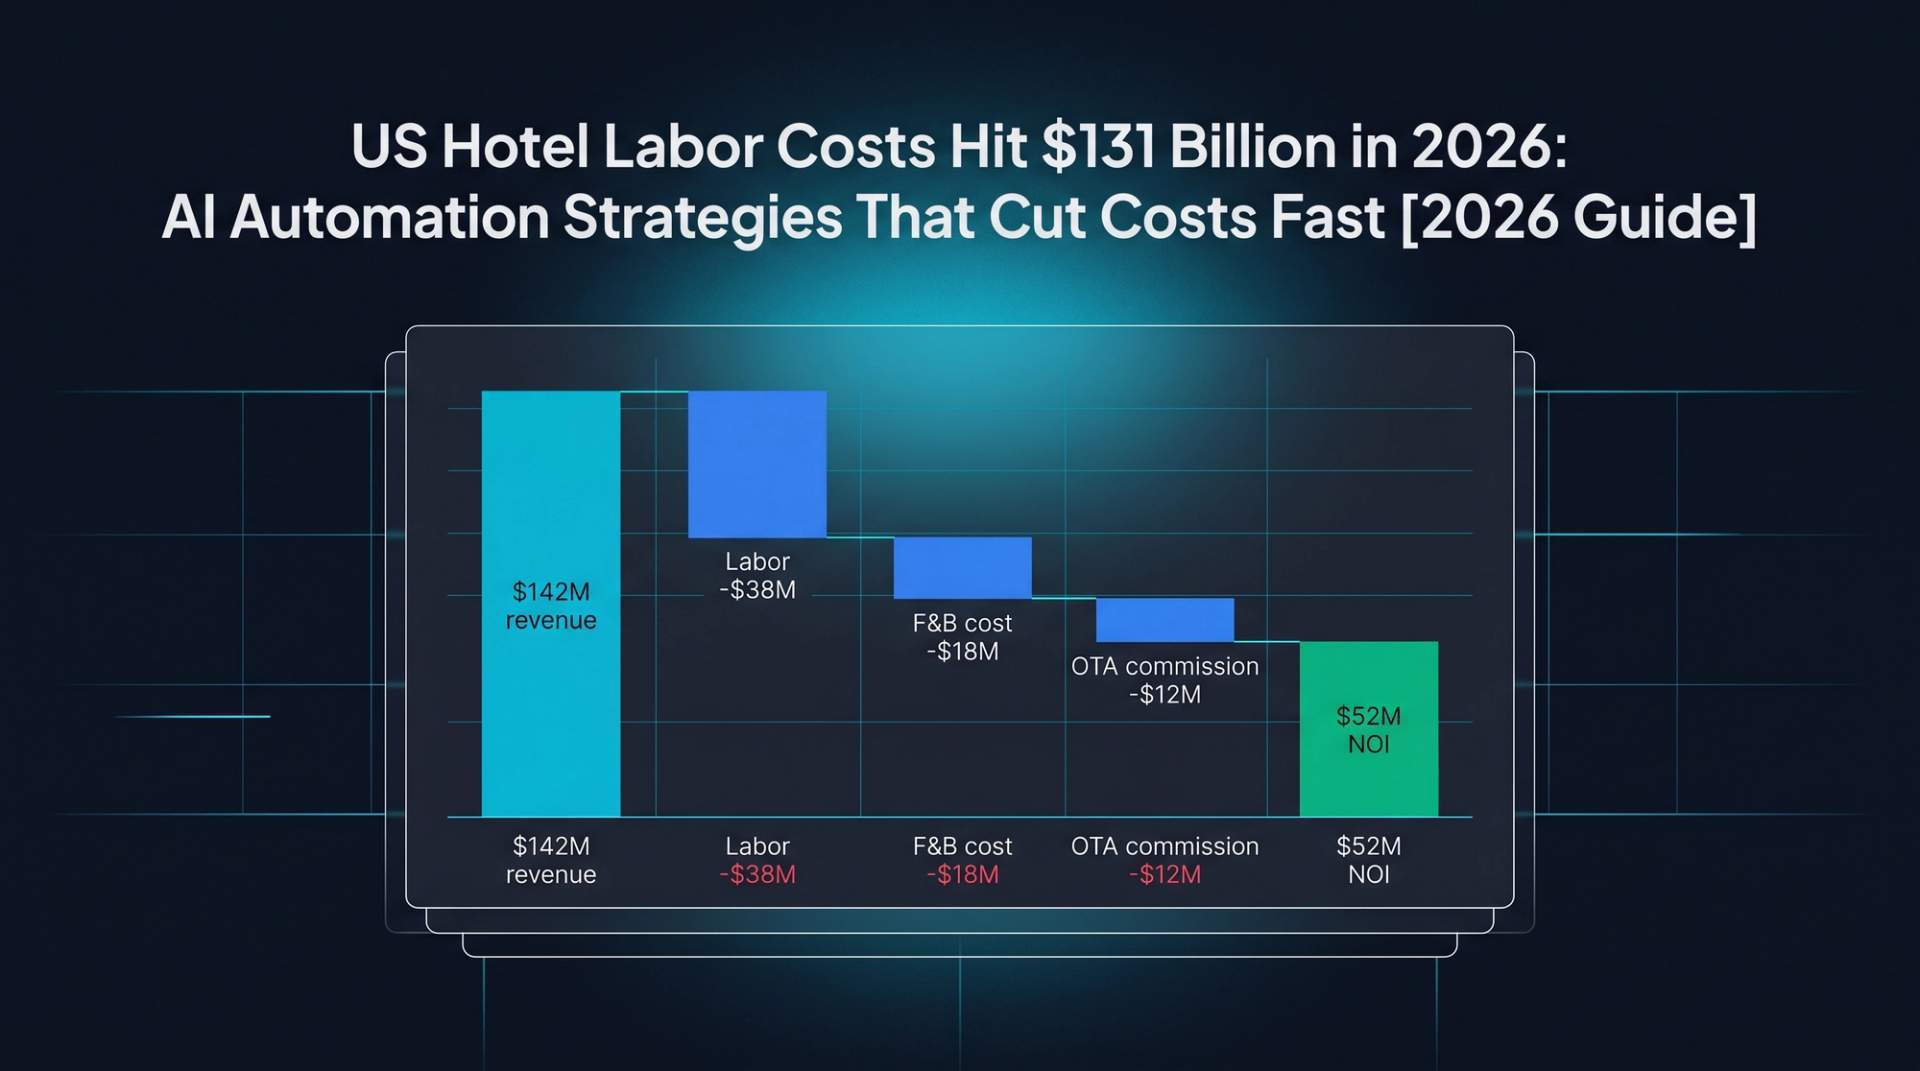
The $131 Billion Pressure Point
According to the American Hotel & Lodging Association (AHLA), total labor costs in the US hotel sector reached $131 billion in 2026. This figure represents a 3.1% increase from the $127 billion recorded in 2025 — the highest level in five years.
Labor costs now account for 52% of total operational expenses at US hotels — exceeding the combined total of other major line items such as energy (12%), technology (8%), and F&B (14%). In AHLA's annual industry survey, 78% of hotel general managers identified labor costs as their "number one financial concern."
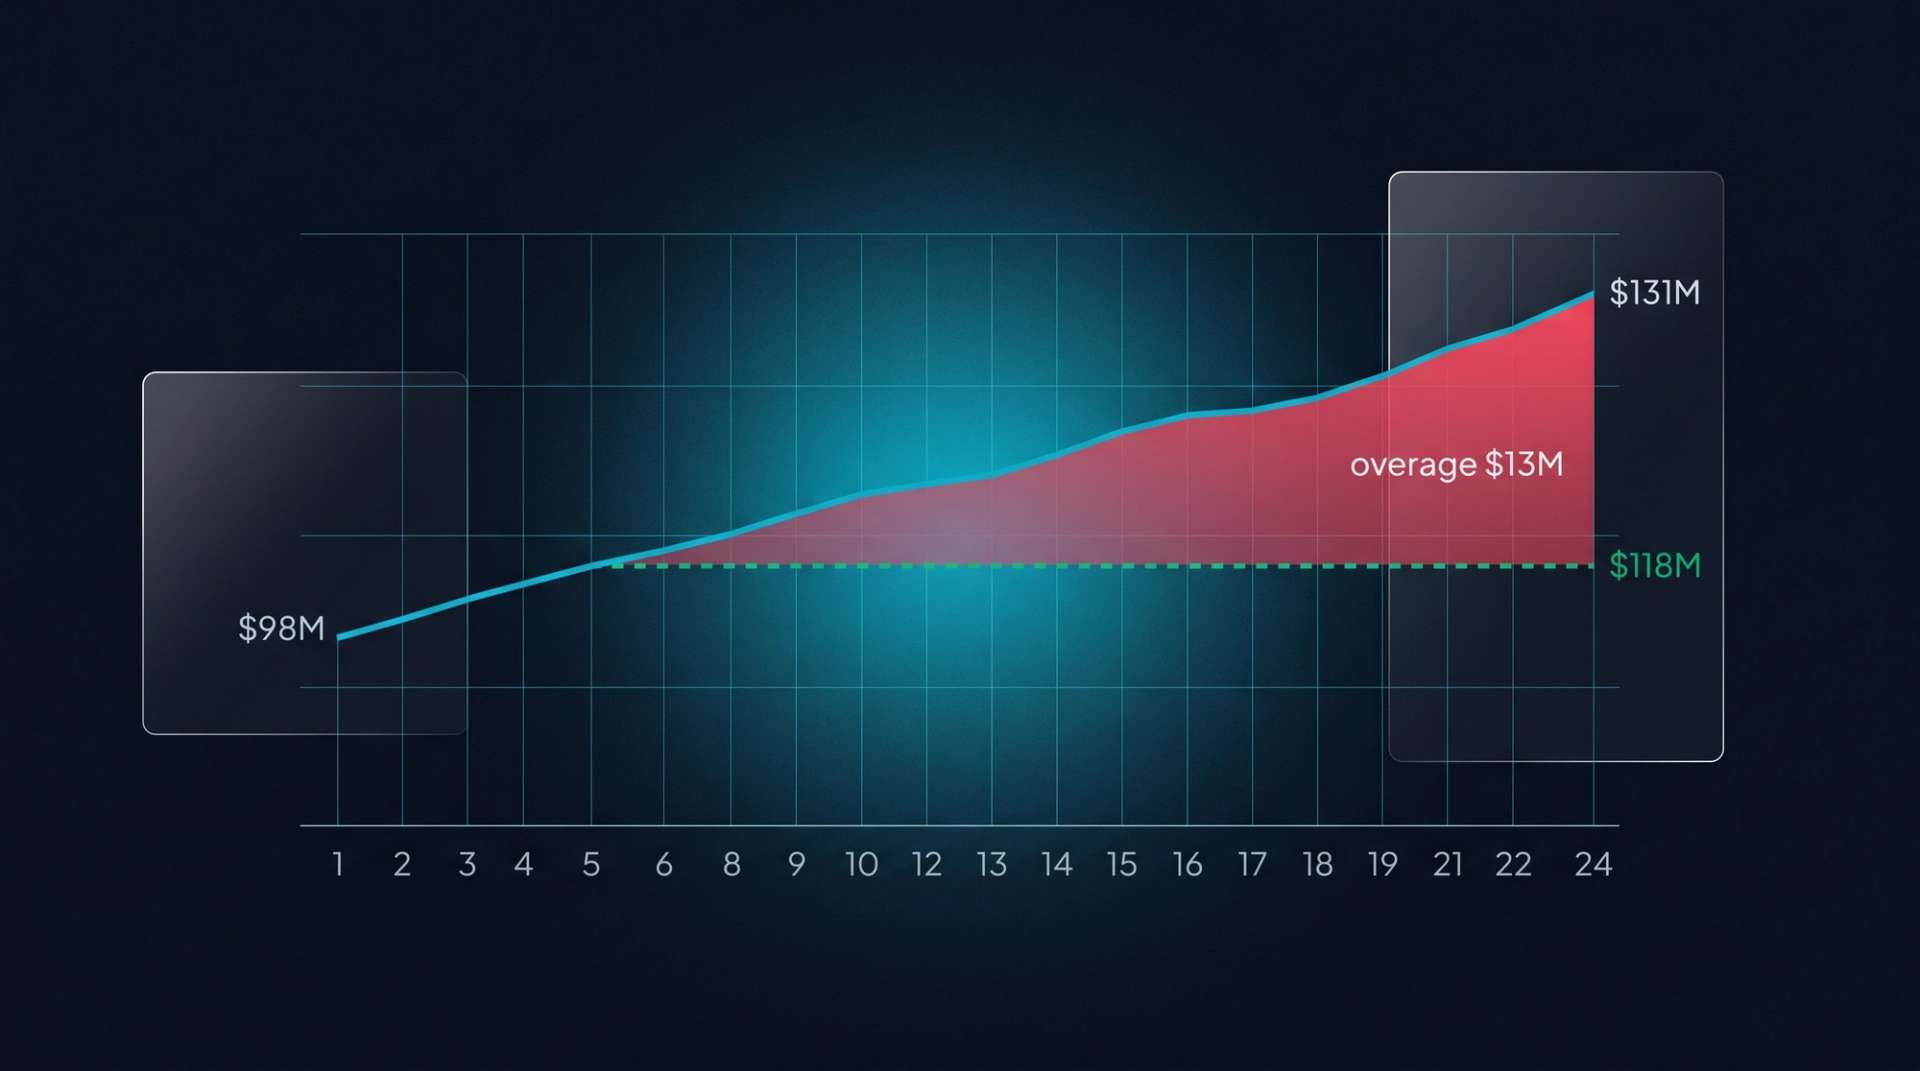
Labor Cost Evolution: 2021–2026
| Year | Total Labor Cost | YoY Growth | Per-Room Labor Cost | Avg. Hourly Wage |
|---|---|---|---|---|
| 2021 | $97 billion | — | $27,800 | $16.83 |
| 2022 | $108 billion | 11.3% | $29,500 | $18.25 |
| 2023 | $118 billion | 9.3% | $31,200 | $19.72 |
| 2024 | $123 billion | 4.2% | $32,800 | $20.48 |
| 2025 | $127 billion | 3.3% | $33,900 | $21.15 |
| 2026 | $131 billion | 3.1% | $35,100 | $21.87 |
While the 11.3% post-pandemic surge has normalized, the rate of increase still outpaces inflation. Per-room annual labor costs have climbed 26.3% since 2021, reaching $35,100.
Embed this image on your site
<a href="https://otelciro.com/en/news/abd-otel-isgucu-maliyeti-131-milyar-2026">
  <img src="https://cdn.sanity.io/images/1la98t0z/production/f692e5eb9ac3190c194f2f9edfc2dfe9f9969e16-2752x1536.jpg" alt="Labor cost chart. Cyan actual rises $98M→$131M. Dashed emerald target at $118M. Rose shaded overage region labeled '$13M overage'." width="800" />
</a>
<p>Source: <a href="https://otelciro.com">OtelCiro</a> — AI Hotel Revenue Management</p>
What's Driving the Cost Surge
1. Structural Labor Shortage
As of 2026, approximately 115,000 positions remain unfilled across the US hotel sector. The shortage is most acute in housekeeping, F&B, and front desk departments.
| Department | Vacancy Rate | Avg. Time-to-Fill | Wage Growth (Annual) |
|---|---|---|---|
| Housekeeping | 18.4% | 47 days | 5.2% |
| F&B (Kitchen) | 15.7% | 52 days | 4.8% |
| Front Desk | 11.2% | 34 days | 3.9% |
| Maintenance | 13.8% | 58 days | 4.1% |
| Sales & Marketing | 7.3% | 41 days | 3.4% |
Housekeeping has both the highest vacancy rate and the longest fill times, forcing hotels to offer increasingly competitive wages.
2. Minimum Wage Increases
As of 2026, 32 US states have enacted minimum wage increases that directly affect the hospitality sector. California's hotel worker minimum wage has risen to $20/hour, while New York City's stands at $18.50/hour.
3. Benefits and Insurance Costs
Health insurance premiums rose an average of 7.2% in 2026, reaching $8,400 per employee per year. When combined with retirement contributions, paid leave, and other benefits, total non-wage costs represent 28–35% of gross compensation.
AI Automation: The Counterbalance to Labor Pressure
Rising labor costs are driving hotels toward AI and automation technologies. According to McKinsey's 2026 Hospitality Technology report, 61% of US hotels have implemented at least one AI automation solution — up from just 23% in 2023.
Automation Applications and Savings Impact
| Technology | Application Area | Avg. Savings | Payback Period |
|---|---|---|---|
| AI Chatbot (Guest Services) | Front desk + call center | 25–35% (staff costs) | 3–6 months |
| Automated Check-in/out Kiosks | Front desk | 40–50% (front desk FTE) | 8–14 months |
| Robotic Housekeeping | Room attendants | 15–20% (efficiency gain) | 18–24 months |
| AI Revenue Management | Sales & Revenue | 8–12% (revenue uplift) | 1–3 months |
| Smart Energy Management | Facilities | 18–25% (energy costs) | 6–12 months |
| Automated Inventory Management | F&B + Procurement | 10–15% (waste reduction) | 4–8 months |
Chatbot ROI: A Detailed Breakdown
AI chatbots stand out as the automation investment with the fastest payback. Here's a typical chatbot ROI calculation for a 200-room US hotel:
Investment:
- Setup and integration: $15,000–25,000
- Monthly subscription: $500–1,500
- Annual total: $21,000–43,000
Returns:
- 45% reduction in front desk calls → 1.5 FTE savings → $52,000/year
- 12% increase in booking conversion → $38,000/year additional revenue
- 8-point improvement in guest satisfaction → repeat-stay revenue
- Total annual value: $90,000+
Net ROI: Investment pays for itself in 3–6 months.
Department-Level Automation Strategies
Front Desk and Guest Relations
Digital check-in, AI chatbots, and mobile key technologies free front desk teams from routine transactions so they can focus on guest experience. This approach aims not to reduce headcount but to redirect existing staff toward higher-value tasks.
The most successful hotels adopt a "hybrid model" rather than full automation:
- Routine inquiries and transactions → AI chatbot
- Complex requests and complaints → human staff
- VIP guest reception → always human
Housekeeping Optimization
AI-powered room status monitoring and task assignment systems improve housekeeping efficiency by 20–30%:
- IoT sensors: Detect the moment a room is vacated and immediately direct cleaning crews
- Smart task assignment: AI learns cleaning durations and creates optimal routing and task distribution
- Predictive maintenance: Pre-failure detection of in-room equipment reduces emergency repair costs
F&B Operations
Food waste reduction and inventory optimization deliver the fastest wins in F&B departments:
- AI demand forecasting: Production plans based on daily guest counts and preferences
- Automated ordering systems: Automatic supplier orders triggered when stock levels hit minimum thresholds
- Dynamic menu pricing: Daily menu price adjustments based on cost and demand
International Perspective: US vs. Turkey
While Turkey's labor costs are significantly lower in absolute terms, the rate of increase is far steeper:
| Metric | US | Turkey | Difference |
|---|---|---|---|
| Labor cost / Total expenses | 52% | 28–35% | US higher |
| Annual wage growth | 3.1% | 35–45% (inflation-driven) | Turkey faster |
| AI automation adoption | 61% | 12–18% | US far ahead |
| Vacancy rate | 13.2% | 8.5% | US higher |
Although inflation-driven wage increases in Turkey create a different dynamic than the structural labor shortage in the US, the outcome is the same: labor cost pressure is mounting and automation is becoming unavoidable.
Action Plan for Emerging Markets
- Start immediately: AI chatbot integration (3–6 month ROI)
- Short term (3–6 months): Digital check-in/out systems
- Medium term (6–12 months): AI-powered staff scheduling and housekeeping optimization
- Long term (12+ months): Fully integrated AI revenue and operations management
Revenue Management Perspective
Controlling labor costs is also a revenue management challenge. AI-powered revenue management systems integrate labor costs directly into pricing decisions:
- Cost-based pricing: Calculate variable cost per room to determine minimum profitable rate
- Demand-supply balancing: Optimize staffing during low-demand periods to reduce fixed costs
- Segment profitability analysis: Calculate labor intensity for each guest segment and prioritize the most profitable ones
OtelCiro's revenue management platform automatically factors labor costs into pricing recommendations, helping hotels protect their GOP margins.
Embed this image on your site
<a href="https://otelciro.com/en/news/abd-otel-isgucu-maliyeti-131-milyar-2026">
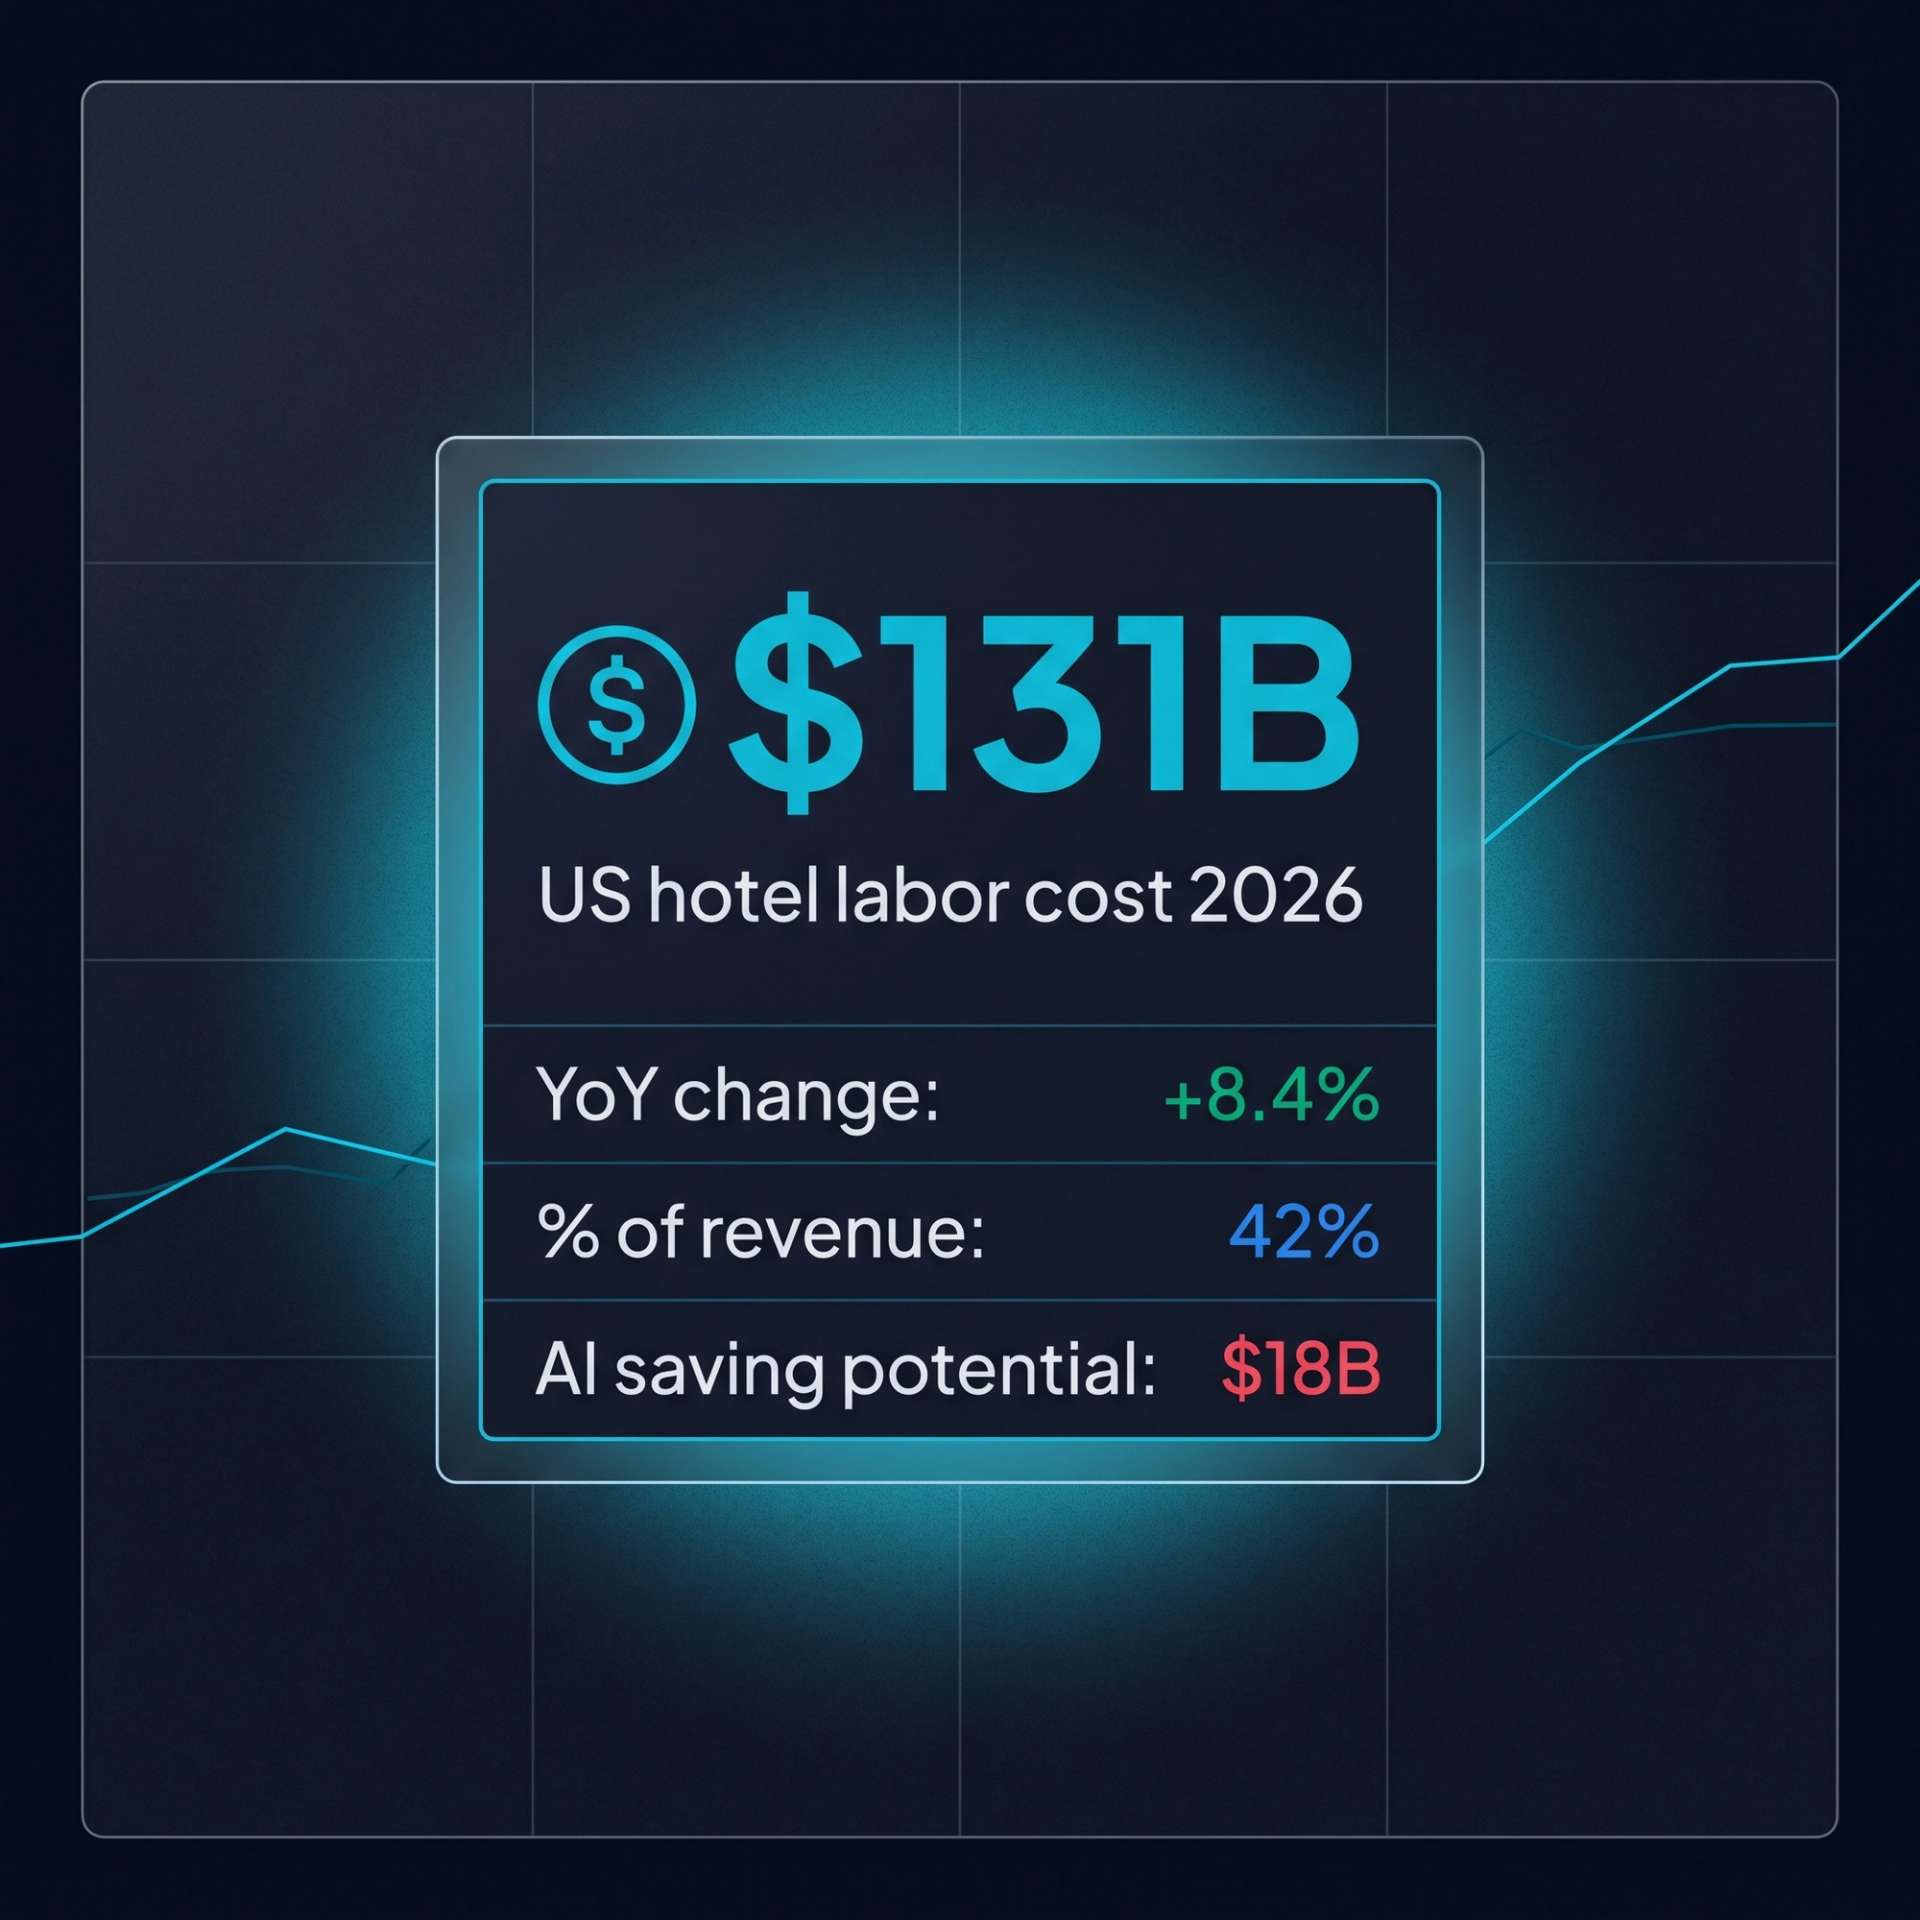
<img src="https://cdn.sanity.io/images/1la98t0z/production/bf4464232ce9eed06a49dd96644509a1464b0252-2048x2048.jpg" alt="Finance tile. $131B US hotel labor cost 2026 headline. Sub-rows: +8.4% YoY, 42% of revenue, $18B AI saving potential." width="800" />
</a>
<p>Source: <a href="https://otelciro.com">OtelCiro</a> — AI Hotel Revenue Management</p>
Conclusion
The $131 billion labor cost picture in the US serves as an early warning for the global hotel industry. Labor costs will continue to rise year after year — this is a structural trend. But AI automation solutions offer powerful tools to offset this pressure.
Chatbots pay for themselves in 3–6 months, digital check-in in 8–14 months, and AI revenue management in 1–3 months. The message is clear: delaying automation investment means absorbing more cost every day.
For hotels worldwide — whether facing structural labor shortages or inflation-driven wage surges — the most effective response is adopting AI and automation technologies today, not tomorrow.
Ready to see how AI-powered revenue management can protect your margins against rising labor costs? Book a demo and discover how OtelCiro helps hotels optimize both pricing and operations.
![Hotel Receivables: Optimize Collection & Boost Cash Flow [2024 Guide]](https://cdn.sanity.io/images/1la98t0z/production/23a6fa553023ee81e92a36a57802e5704f9d99a3-1200x669.png?w=1920&q=50&auto=format&fit=max)
![Hotel Depreciation & Asset Management: 2026 Strategy [Guide]](https://cdn.sanity.io/images/1la98t0z/production/45509074dba966d0744eb35d56270b3268d27a64-1200x669.png?w=1920&q=50&auto=format&fit=max)