![Seasonal Revenue Target Planning: 2026 Hotel Budgeting [Strategy Guide]](https://cdn.sanity.io/images/1la98t0z/production/b58ea283752af47e3715ce1a79ea25710bfdfade-1200x669.png?w=1920&q=65&auto=format&fit=max)
Key Takeaways
- Traditional budgeting methods often result in a 12-18% variance in revenue targets, whereas AI-powered models reduce this to 3-5%.
- Effective planning requires a structured Four-Season Model: Peak, Shoulder, Low, and Special Events.
- Revenue targets should be built on five core pillars: Historical Data, Market Trends, Event Layers, CompSet Analysis, and Internal Factors.
- Utilizing a Seasonality Index prevents the "smoothing trap" by aligning monthly targets with actual demand patterns.
- Monthly forecast revisions are essential, as hotels that update forecasts regularly see significantly lower year-end deviations.
Budget Planning: Intuitive or Systematic?
In the final quarter of every year, hotel management teams undergo the same ritual: preparing the budget for the following year. In most hotels, this process involves adding a 5-10% growth margin to last year’s figures, keeping the seasonal distribution identical to the previous year, and setting a target. The primary issue with this approach is that it ignores the reality that the future is not a carbon copy of the past.
According to research by Horwath HTL, revenue targets set using traditional budgeting methods show an average deviation of 12-18% from actual results. This variance can be both upward and downward—and both directions are problematic. If the target is set too low, opportunities are missed; if set too high, profitability drops as teams attempt to hit targets through aggressive discounting.
Embed this image on your site
<a href="https://otelciro.com/en/news/seasonal-revenue-target-planning-2026-hotel-budgeting-strategy-guide">
  <img src="https://cdn.sanity.io/images/1la98t0z/production/b58ea283752af47e3715ce1a79ea25710bfdfade-1200x669.png" alt="Seasonal Revenue Target Planning Infographic" width="800" />
</a>
<p>Source: <a href="https://otelciro.com">OtelCiro</a> — AI Hotel Revenue Management</p>
AI-powered forecasting models reduce this deviation to the 3-5% range. So, how do you perform systematic seasonal revenue target planning?
Related reading: Hotel Seasonality Management: Seasonal Strategies
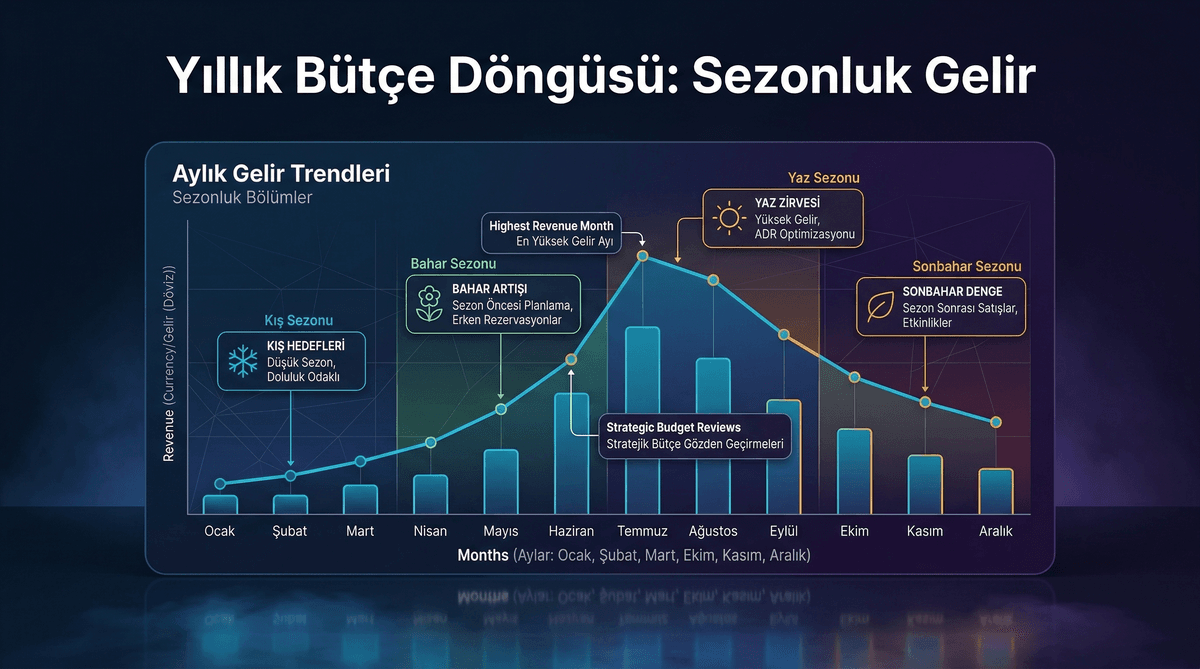
Defining Seasons: The Four-Tier Model
The first step is to accurately define your hotel's seasonal structure. Hotels in Turkey generally use a four-season model, though season dates vary for every property and destination.
Peak Season
The period of highest demand. This includes June-September for coastal resorts or busy convention/fair dates for city hotels. The goal for peak season: 85-95% occupancy, maximum ADR.
Shoulder Season
The transition periods entering and exiting the peak season. April-May and October-November are usually considered shoulder seasons. These periods hold the greatest revenue opportunities because, with the right strategy, performance close to peak season can be achieved. Goal: 65-80% occupancy, medium-high ADR.
Low Season
The period when demand bottoms out. January-February and, in some destinations, November-December. The goal during this period is to maintain cash flow and cover fixed costs. Occupancy 40-60%, flexible ADR.
Special Events
Calendar-dependent high-intensity periods such as religious holidays, festivals, congresses, and sporting events. These periods offer premium pricing opportunities regardless of the general seasonal classification. Occupancy goal 95%+, ADR 30-50% higher than normal periods.
Budget Building Blocks
Five fundamental building blocks are used when determining the revenue target for each season:
1. Historical Data Analysis (Base)
The seasonal performance of the last three years forms the basis for identifying trends. However, normalized data should be used rather than raw data:
- Filter out anomalies like pandemics or natural disasters.
- Normalize changes in room count or service scope.
- Adjust for inflation and exchange rate effects based on a stable currency.
- Separate the impact of temporary events (Olympics, major congresses, etc.).
2. Market Trends (Growth)
Growth trends of the destination and segment are added on top of historical data:
- Destination growth rate: Ministry of Culture and Tourism data, airport passenger statistics.
- Segment trends: Recovery of business travel, growth in wellness tourism, the digital nomad influx.
- New supply: The impact of new hotels opening in the region on occupancy (every 100 new rooms can reduce the occupancy of existing hotels by 1.5-3%).
- Economic indicators: Economic health of source markets, exchange rates.
3. Event Calendar (Event Layer)
The regional and national event calendar modifies seasonal targets:
- International congresses and trade fairs.
- Cultural festivals and holidays.
- Sporting events (mega-events like the 2026 FIFA World Cup).
- New flight routes and frequency increases.
4. Competitive Analysis (CompSet)
Capacity changes, renovation plans, and pricing strategies of competing hotels:
- If a hotel in the CompSet undergoes renovation, a temporary demand shift occurs.
- If a new competitor opens, market share is affected.
- If competitor price strategies change, your own strategy must be adjusted accordingly.
5. Internal Factors
Internal hotel changes directly affect the budget:
- Planned renovations (temporary reduction in room count).
- New services (spa opening, restaurant revision).
- Changes in staff capacity and service quality.
- Marketing budget and campaign plans.
The OtelCiro reporting module combines these five layers into a single forecasting model to generate data-driven revenue targets for every season.
Monthly Distribution: The Smoothing Trap
Distributing the annual revenue target equally across 12 months is one of the most common mistakes. It is necessary to determine the monthly distribution realistically using a seasonality index.
Seasonality Index Formula:
Monthly Index = Average Revenue of That Month (3 years) / Annual Average Monthly Revenue
Example (Antalya resort hotel):
| Month | Index | Annual Target Share |
|---|---|---|
| January | 0.35 | 2.9% |
| February | 0.40 | 3.3% |
| March | 0.55 | 4.6% |
| April | 0.85 | 7.1% |
| May | 1.20 | 10.0% |
| June | 1.50 | 12.5% |
| July | 1.80 | 15.0% |
| August | 1.85 | 15.4% |
| September | 1.40 | 11.7% |
| October | 1.05 | 8.8% |
| November | 0.60 | 5.0% |
| December | 0.45 | 3.7% |
This distribution ensures that targets are realistic and that each month is evaluated according to its own dynamics. Failing to reach a target in July requires different strategic interventions than failing to reach a target in January.
Forecast vs. Budget: Live Revisions
The budget set at the beginning of the year must be revised according to changing conditions during the year. This revision is kept separately as a "forecast"—the budget remains fixed, while the forecast is updated.
Checklist for monthly forecast revision:
- Actual vs. budget variance analysis.
- Pick-up status for the next 90 days.
- Changes in market conditions.
- Competitor price and capacity updates.
- Information on new events or cancellations.
Research reveals that hotels performing monthly forecast revisions show a year-end revenue deviation of 4-6%, while those making no revisions show a 15-20% deviation.
Related reading: Hotel Revenue Forecasting with AI
Conclusion: Plan, Track, Adapt
Seasonal revenue target planning should not be an exercise performed once a year and then shelved. As a dynamic process, a living budget must be supported by regular forecast revisions and season-based strategy adjustments.
AI-powered forecasting dramatically increases both the accuracy and speed of this process. While the traditional budgeting process takes 4-6 weeks, AI reduces this to 2-3 days, while bringing forecast accuracy from a 12-18% deviation down to 3-5%.
Plan your seasonal revenue targets with data-driven insights, track them in real-time, and adapt instantly to market changes with OtelCiro reporting solutions.
![Hotel Ancillary Revenue: Monetizing Spa, F&B & Activities [2026 Guide]](https://cdn.sanity.io/images/1la98t0z/production/cfce3407a5ef8f70edd19853e8059317fca7b6a6-2752x1536.jpg?w=1920&q=50&auto=format&fit=max)
![FIFA 2026 World Cup: Hotel Dynamic Pricing Strategy [2026 Guide]](https://cdn.sanity.io/images/1la98t0z/production/7a76affe61333341ec47bb0c705011068a1afd24-2752x1536.jpg?w=1920&q=50&auto=format&fit=max)