![RevPAR vs. Occupancy: The Right Metric for Hotel Success [2026 Guide]](https://cdn.sanity.io/images/1la98t0z/production/6f36d5ffc0f443156e45a7135eebb05687ac933d-1376x768.jpg?w=1920&q=65&auto=format&fit=max)
Key Takeaways
- Beyond Occupancy: While occupancy rate is a common metric, relying solely on it can be misleading. Hotels focusing only on occupancy may achieve 8-15% lower annual revenue compared to those prioritizing RevPAR.
- RevPAR as the Core KPI: Revenue Per Available Room (RevPAR) is the most critical key performance indicator (KPI) as it holistically evaluates both occupancy and average daily rate (ADR), providing a true measure of a hotel's room revenue efficiency.
- Strategic Metric Hierarchy: Adopt a "metric pyramid" approach, moving from foundational metrics like ADR and Occupancy to RevPAR, Total Revenue Per Available Room (TRevPAR), and ultimately Gross Operating Profit Per Available Room (GOPPAR) for comprehensive performance analysis.
- Maximize, Don't Just Fill: Instead of blindly aiming for 100% occupancy, focus on maximizing RevPAR by strategically balancing occupancy increases during low demand periods with ADR increases during high demand.
- Data-Driven Decisions: Leverage real-time reporting tools, such as OtelCiro, to track all key metrics, conduct benchmark comparisons, analyze trends, and make informed, data-driven revenue management decisions.
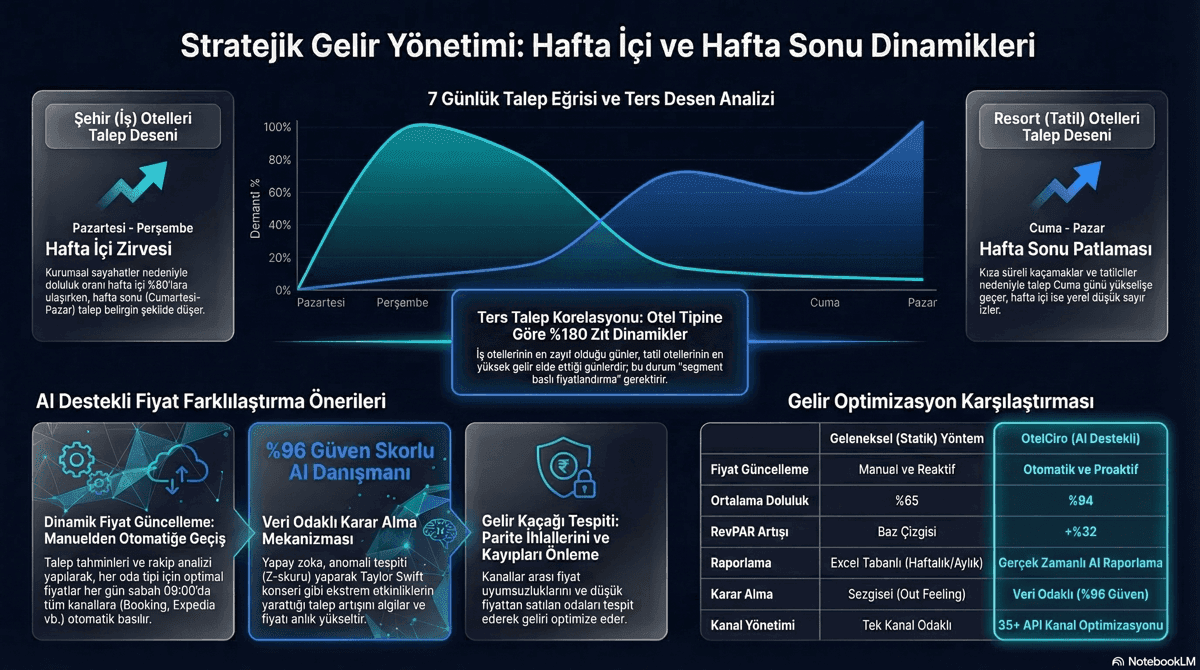
Occupancy Rate Can Be Misleading
The most commonly used metric in the hospitality industry is the occupancy rate. The phrase "%90 full" might sound like a success. However, a 90% occupancy with low prices can generate less revenue than 65% occupancy with high prices. This is where RevPAR (Revenue Per Available Room) comes into play.
The comparison between occupancy rate vs. RevPAR is a fundamental revenue management concept that every hotel manager must understand. Making the right hotel metric comparison directly impacts the quality of strategic decisions.
According to STR data, hotels that pursue an occupancy-only strategy achieve 8-15% lower annual revenue compared to a RevPAR-focused strategy. This is because occupancy is only half the picture.

Embed this image on your site
<a href="https://otelciro.com/en/news/revpar-vs-occupancy-the-right-metric-for-hotel-success-2026-guide">
  <img src="https://cdn.sanity.io/images/1la98t0z/production/6f36d5ffc0f443156e45a7135eebb05687ac933d-1376x768.jpg" alt="Infographic comparing occupancy rate and RevPAR, and the metric pyramid" width="800" />
</a>
<p>Source: <a href="https://otelciro.com">OtelCiro</a> — AI Hotel Revenue Management</p>
Related reading: How Many Hours A Year Does Your Hotel Run Empty? The True Cost of a Vacant Room
Related reading: Dynamic vs. Static Pricing: Elevate Your Profits with the Taylor Swift Effect
Definition and Calculation of Metrics
Occupancy Rate
Occupancy = Rooms Sold / Total Available Rooms × 100
Example: 80 rooms sold / 100 total rooms = 80% occupancy
What it measures: Capacity utilization Drawback: Does not include price information
ADR (Average Daily Rate)
ADR = Total Room Revenue / Number of Rooms Sold
Example: 120,000 TL / 80 rooms = 1,500 TL ADR
What it measures: Average price of rooms sold Drawback: Does not account for unsold rooms
RevPAR (Revenue Per Available Room)
RevPAR = Total Room Revenue / Total Available Rooms
or
RevPAR = ADR × Occupancy Rate
Example: 120,000 TL / 100 rooms = 1,200 TL RevPAR or 1,500 TL × 0.80 = 1,200 TL RevPAR
What it measures: Average revenue generated from all rooms (sold + vacant) Advantage: Evaluates occupancy and price together
Embed this image on your site
<a href="https://otelciro.com/en/news/revpar-vs-occupancy-the-right-metric-for-hotel-success-2026-guide">
  <img src="https://cdn.sanity.io/images/1la98t0z/production/c0edb393f0dd45ca1363f938dbc43e2d65427273-1200x670.png" alt="TRevPAR total revenue management calculation" width="800" />
</a>
<p>Source: <a href="https://otelciro.com">OtelCiro</a> — AI Hotel Revenue Management</p>
Why Occupancy Alone Isn't Enough
Comparison Scenario
| Scenario | ADR | Occupancy | RevPAR | Daily Revenue (100 rooms) |
|---|---|---|---|---|
| A: High occupancy | 1,000 TL | %95 | 950 TL | 95,000 TL |
| B: Balanced | 1,500 TL | %70 | 1,050 TL | 105,000 TL |
| C: Premium price | 2,200 TL | %50 | 1,100 TL | 110,000 TL |
Result: The highest occupancy (Scenario A) yields the lowest revenue! Scenario C achieves the highest revenue with 50% occupancy.
The Occupancy Trap
Aiming for 100% occupancy leads to the following problems:
- Price pressure: Drastically lowering prices just to be full.
- Segment shift: Attracting low-value guests.
- Operational stress: Issues with full-capacity operations.
- Opportunity cost: Turning away high-priced last-minute guests.
- Maintenance deferral: Inability to perform renovations due to no vacant rooms.
Related reading: Dynamic Pricing and AI: The Complete Guide to Hotel Price Optimization with Artificial Intelligence
Related reading: 65% of Travelers Accept Dynamic Pricing: Transparency Builds Trust
The Right Metric Pyramid
A single metric is not enough to measure hotel performance. A hierarchical approach is required:
Metric Hierarchy
GOPPAR (Most comprehensive - profitability)
    ↑
TRevPAR (Total revenue)
    ↑
RevPAR (Room revenue efficiency) ← Primary KPI
    ↑
ADR (Pricing performance)    Occupancy (Capacity utilization)
Which Metric, Which Decision?
| Decision Type | Primary Metric | Supporting Metric |
|---|---|---|
| Daily price adjustment | ADR + Occupancy | RevPAR, Pace |
| Weekly performance | RevPAR | ADR, Occupancy, Cancellation rate |
| Monthly strategy | RevPAR + TRevPAR | GOPPAR, Segment distribution |
| Annual budget | GOPPAR | TRevPAR, RevPAR, ADR |
| Promotion decision | RevPAR increase | Occupancy change, ADR impact |
| Channel evaluation | NRevPAR | Commission rate, Net revenue |
Embed this image on your site
<a href="https://otelciro.com/en/news/revpar-vs-occupancy-the-right-metric-for-hotel-success-2026-guide">
  <img src="https://cdn.sanity.io/images/1la98t0z/production/478f5db040f44d04277ebede886a2a95c18deda3-1200x669.png" alt="Occupancy-based pricing strategy" width="800" />
</a>
<p>Source: <a href="https://otelciro.com">OtelCiro</a> — AI Hotel Revenue Management</p>
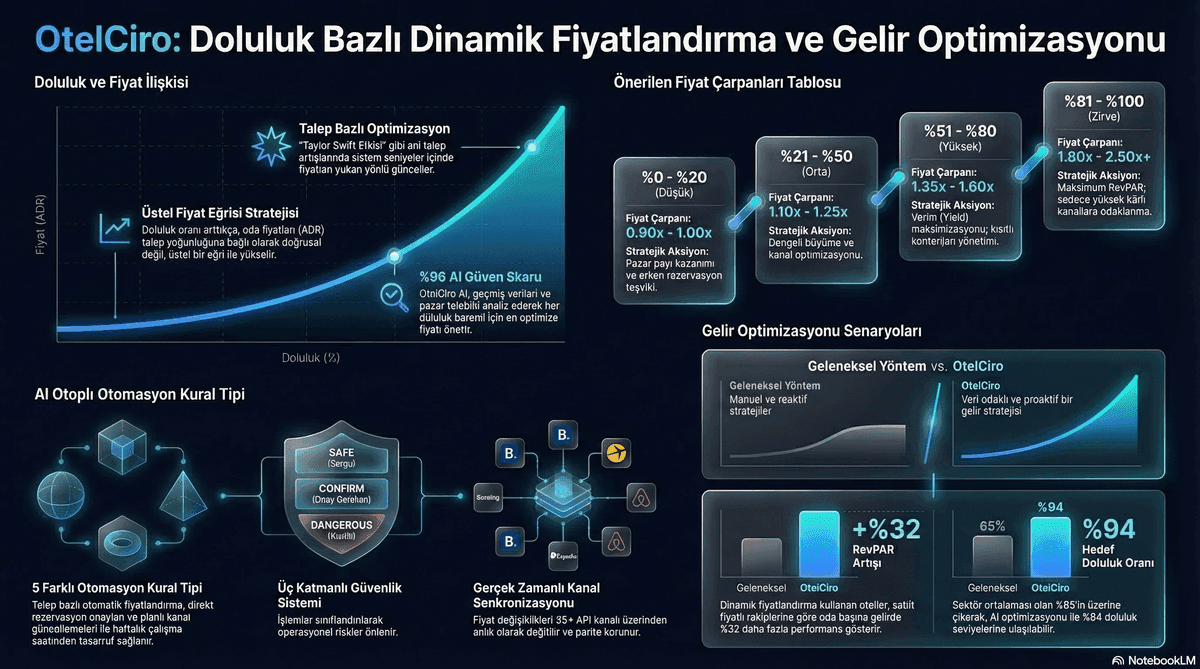
3 Ways to Increase RevPAR
1. Increase Occupancy (ADR Constant)
During low season or periods of low occupancy, focus on increasing occupancy while maintaining price.
Tools: Promotions, Visibility Boosters, channel diversification
2. Increase ADR (Occupancy Constant)
During periods of high demand, increase price while maintaining occupancy.
Tools: Dynamic pricing, upselling, package sales
3. Increase Both Simultaneously
The ideal scenario: both occupancy and ADR increase together. This is usually possible through:
- Increased review scores
- Improved listing quality
- Enhanced brand awareness
RevPAR Benchmark Analysis
Turkey Hotel Sector 2026 (Estimated)
| Segment | Average Occupancy | Average ADR | Average RevPAR |
|---|---|---|---|
| 5-star city | %68 | 2,800 TL | 1,904 TL |
| 4-star city | %72 | 1,600 TL | 1,152 TL |
| 5-star resort | %65 | 3,200 TL | 2,080 TL |
| 4-star resort | %70 | 1,800 TL | 1,260 TL |
| Boutique | %62 | 2,000 TL | 1,240 TL |
Compare Yourself to the Benchmark
If your RevPAR is:
- %20+ above: Excellent performance
- 10-20% above: Strong performance
- Within ±10% range: Average
- 10-20% below: Improvement needed
- %20+ below: Urgent action required
Related reading: What is Dynamic Pricing? 5 Ways to Increase Your Hotel Revenue
Tracking Metrics with OtelCiro
OtelCiro's reporting module monitors all key metrics like occupancy, ADR, RevPAR, TRevPAR, and GOPPAR in real-time. With benchmark comparisons and trend analyses, you can evaluate your performance from every angle.
- Real-time dashboard: All metrics instantly available
- Benchmark comparison: Compare with your compset and industry average
- Trend analysis: Daily, weekly, monthly trends
- Alert system: Warnings for deviations from metric targets
Explore OtelCiro Reporting Module
Related topics: Hotel ADR Enhancement Strategies and TRevPAR Total Revenue Management.
Conclusion
Occupancy rate is an important metric, but it can be misleading on its own. RevPAR evaluates occupancy and price together to measure a hotel's true performance. Instead of aiming for 100% occupancy, find the occupancy-price balance that maximizes RevPAR. Understand the metric pyramid and support every decision with the right metric.
![Hotel Ancillary Revenue: Monetizing Spa, F&B & Activities [2026 Guide]](https://cdn.sanity.io/images/1la98t0z/production/cfce3407a5ef8f70edd19853e8059317fca7b6a6-2752x1536.jpg?w=1920&q=50&auto=format&fit=max)
![FIFA 2026 World Cup: Hotel Dynamic Pricing Strategy [2026 Guide]](https://cdn.sanity.io/images/1la98t0z/production/7a76affe61333341ec47bb0c705011068a1afd24-2752x1536.jpg?w=1920&q=50&auto=format&fit=max)