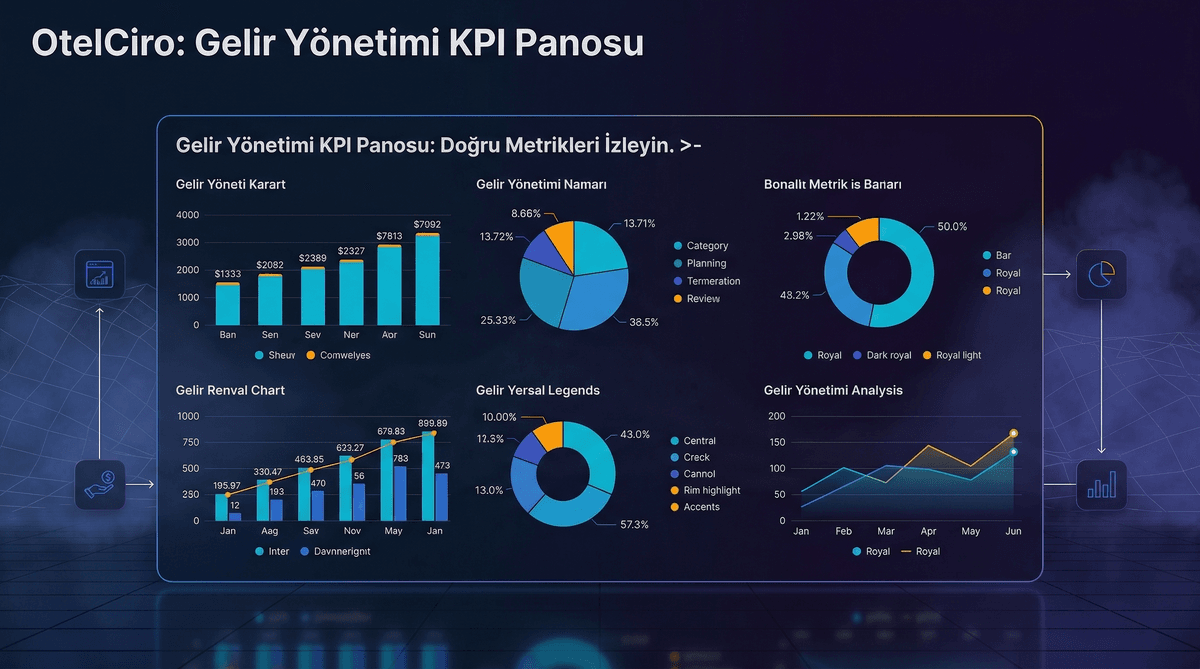
![Hotel Revenue Management KPI Dashboard [2026 Guide]](https://cdn.sanity.io/images/1la98t0z/production/829117cc0ef703761a625372d5f215526e0d675c-1200x669.png?w=1920&q=65&auto=format&fit=max)
Key Takeaways
- Data Overload, Not Scarcity: Modern hotels face an abundance of data from various systems, yet only 18% consistently integrate this data into strategic decisions, leading to "data richness, decision poverty."
- Focus on Core Metrics: The solution isn't tracking everything but monitoring the right metrics. An effective KPI dashboard streamlines complex data into actionable insights for faster, better revenue management decisions.
- Essential KPIs: Core metrics include Occupancy Rate, Average Daily Rate (ADR), and Revenue Per Available Room (RevPAR). Advanced metrics like TRevPAR, GOPPAR, Net RevPAR, and Booking Window provide a holistic financial view.
- Strategic Dashboard Design: Dashboards should follow information hierarchy (30s, 2min, 5min+ views), utilize the 4B Model for comparisons (Budget, Benchmark, Before, Best), and incorporate proactive alert systems for critical deviations.
- Avoid Common Pitfalls: Combat common errors such as tracking too many metrics, being overly past-focused, ignoring correlations between metrics, and using outdated data. Prioritize real-time, correlated, and forecast-driven insights.
Data Richness, Decision Poverty
In modern hospitality, a lack of data is no longer an issue — an excess of data has become the problem. PMS, channel managers, OTA extranets, CRM, POS, accounting systems, and web analytics tools generate hundreds of data points daily. However, 80% of this data never translates into a meaningful decision-making process.
According to McKinsey's 2025 Hospitality Digital Maturity report, only 18% of hotels regularly integrate their data into strategic decisions. The remaining 82% either don't track data at all, track too many metrics, or look backward with delayed reports.
Embed this image on your site
<a href="https://otelciro.com/en/news/hotel-revenue-management-kpi-dashboard-2026-guide">
  <img src="https://cdn.sanity.io/images/1la98t0z/production/829117cc0ef703761a625372d5f215526e0d675c-1200x669.png" alt="Gelir Yönetimi KPI Panosu İnfografiği" width="800" />
</a>
<p>Source: <a href="https://otelciro.com">OtelCiro</a> — AI Hotel Revenue Management</p>
The solution is not to monitor everything, but to monitor the right metrics at the right frequency. A well-designed KPI dashboard transforms complex data sets into understandable information at a glance, dramatically increasing the speed and quality of revenue management decisions.
Related reading: Hotel Business Intelligence and Reporting
Core Revenue Metrics: The Golden Triangle
At the heart of every revenue management KPI dashboard should be three fundamental metrics:
1. Occupancy Rate
Formula: Rooms Sold / Available Rooms × 100
Occupancy rate is the most basic indicator of inventory utilization efficiency. However, it can be misleading on its own — 100% occupancy is a failure, not a success, if prices were kept too low.
Monitoring frequency: Daily Comparison: Year-over-year (YoY), budget target, CompSet average Alert thresholds: 10% below target (yellow), 20% below target (red)
2. Average Daily Rate (ADR)
Formula: Total Room Revenue / Rooms Sold
ADR measures the effectiveness of the pricing strategy. A rising ADR with falling occupancy, or vice versa, indicates an imbalance in the strategy.
Monitoring frequency: Daily Comparison: YoY, budget, CompSet Alert thresholds: 5% below budget (yellow), 10% below budget (red)
3. Revenue Per Available Room (RevPAR)
Formula: Total Room Revenue / Available Rooms or ADR × Occupancy Rate
RevPAR combines occupancy and pricing balance into a single metric and is the "north star" metric of revenue management. A 1% increase in RevPAR translates to approximately 200,000-350,000 TL in annual additional revenue for a 200-room hotel.
Monitoring frequency: Daily Comparison: YoY, budget, CompSet (STR report) Alert thresholds: 5% below CompSet (yellow), 10% below CompSet (red)
Advanced Metrics: Seeing the Full Picture
Beyond the core triangle, a comprehensive KPI dashboard should also include the following metrics:
TRevPAR (Total Revenue Per Available Room)
A total revenue metric that includes income from all departments (F&B, spa, events, parking, etc.). It is critical for moving beyond room revenue-focused decision-making. According to industry data, 72% of hotels that started monitoring TRevPAR achieved an 8-15% increase in additional departmental revenue.
GOPPAR (Gross Operating Profit Per Available Room)
The gross operating profit metric remaining after deducting operational expenses from revenue. It is the most "honest" performance indicator — if high revenue is coupled with high costs, GOPPAR will reveal it.
GOPPAR = (Total Revenue - Operational Expenses) / Available Rooms
Net RevPAR
Net room revenue remaining after deducting commissions and distribution costs. Indispensable for measuring the effectiveness of the channel strategy.
Booking Window
Average lead time — the duration between the booking date and the check-in date. This metric determines the timing of the pricing strategy. A shrinking booking window indicates an increase in last-minute demand and suggests that the early pricing strategy needs revision.
With the OtelCiro reporting module, you can monitor all these metrics on a single dashboard, in real-time.
Dashboard Design Principles
Information Hierarchy
An effective KPI dashboard should guide the user's eye in the correct sequence:
Top layer (30 seconds): Today's occupancy, ADR, RevPAR — large numbers with color coding. Green = above target, red = below target. The general manager should be able to look at this layer and get an instant answer to "how are we doing today?"
Middle layer (2 minutes): Weekly and monthly trends, CompSet comparison, channel-based performance. The revenue manager finds data for strategic decisions in this layer.
Bottom layer (5+ minutes): Segment-based details, room type performance, pick-up reports, forecast vs. actual comparison. Used for detailed analysis.
Comparison Framework: The 4B Model
Every metric should be evaluated across four comparison dimensions:
- Budget: Performance against the target set at the beginning of the year
- Benchmark: Position relative to CompSet and market average
- Before: Comparison to the same period last year and last month
- Best: Proximity to record performance values
Alert System
The dashboard should not be a passive indicator, but a proactive alert system:
- Pick-up alert: Automatic alert if today's pick-up is 50% below the same day last year
- Price alert: Notification if one of the competitor hotels changes its price by 15%+
- Occupancy forecast deviation: Call for strategy revision if the forecast deviates by 10%+
- Channel balance disruption: Request for analysis if a channel's share increases/decreases by 5%+
Common Mistakes and Solutions
Mistake 1: Tracking too many metrics. A dashboard with 50+ metrics is as ineffective as tracking none. Solution: Start with a maximum of 12-15 core metrics, and provide details as drill-downs.
Mistake 2: Past-oriented focus. A dashboard showing only yesterday's and last month's data leads to reactive decision-making. Solution: Emphasize forecast metrics at least as much as historical data.
Mistake 3: Correlation blindness. Displaying metrics in isolation hides the relationships between them. Solution: If ADR is rising while occupancy is falling, show these two metrics side-by-side and calculate the net RevPAR impact.
Mistake 4: Update delays. A weekly updated dashboard is insufficient in the era of dynamic pricing. Solution: Core metrics should be updated in real-time, and detailed analyses daily.
Related reading: Hotel TRevPAR and Total Revenue Management
Conclusion: You Can't Manage What You Don't Measure
Peter Drucker's famous quote also applies to hospitality: you can't manage what you don't measure. However, trying to measure everything also means you can't manage. A well-designed KPI dashboard presents the right metrics at the right frequency, within the correct comparison framework, accelerating and improving the quality of revenue management decisions.
![Hotel Ancillary Revenue: Monetizing Spa, F&B & Activities [2026 Guide]](https://cdn.sanity.io/images/1la98t0z/production/cfce3407a5ef8f70edd19853e8059317fca7b6a6-2752x1536.jpg?w=1920&q=50&auto=format&fit=max)
![FIFA 2026 World Cup: Hotel Dynamic Pricing Strategy [2026 Guide]](https://cdn.sanity.io/images/1la98t0z/production/7a76affe61333341ec47bb0c705011068a1afd24-2752x1536.jpg?w=1920&q=50&auto=format&fit=max)