![Hotel Pace Analysis: Pricing Strategy Guide [2026]](https://cdn.sanity.io/images/1la98t0z/production/e883ba49b6cf5e03174fb9b9d995395479639996-1376x768.jpg?w=1920&q=65&auto=format&fit=max)
Key Takeaways
- Pace analysis is a vital revenue management tool that provides real-time demand signals by tracking booking speed.
- Comparing your current booking pace against historical data (e.g., last year) reveals demand strength, guiding proactive pricing adjustments.
- Pick-up analysis monitors net new bookings over short periods, helping identify immediate demand shifts caused by events or campaigns.
- Implement a data-driven, pace-based pricing strategy using a decision matrix to optimize rates according to booking pace and lead time.
- Beware of common pitfalls such as abnormal historical data, the impact of cancellations, segment mix changes, and ignoring the price factor when evaluating pace.
Pace Analysis: The Compass of Revenue Management
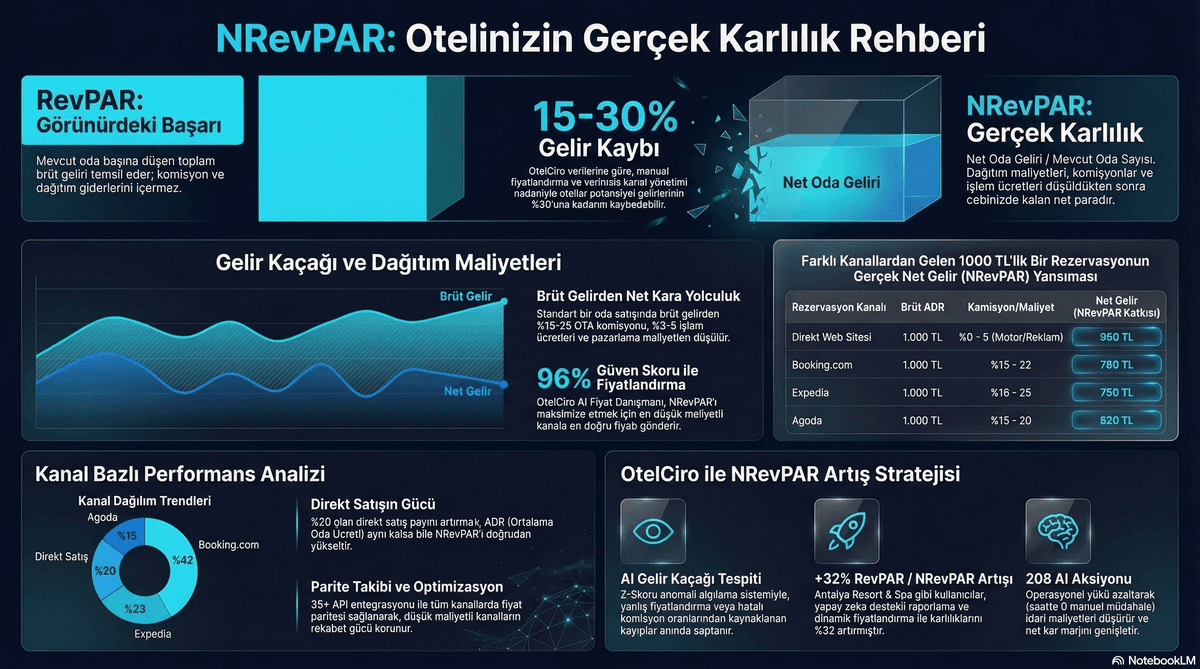
Pace analysis (booking speed analysis) involves monitoring how quickly reservations are coming in for a specific date and comparing this speed to past periods. Pace analysis is the most powerful decision support tool in hotel revenue management because it offers real-time demand signals.
Booking speed is the most reliable indicator of a hotel's future demand. If bookings are accumulating faster than the same period last year, demand is strong, and you have an opportunity to increase prices. If they are accumulating slower, you can take early action to prevent occupancy loss.
Hotels that correctly interpret booking pace data make pricing decisions proactively, not reactively. This can make an 8-15% difference in annual revenue.

Embed this image on your site
<a href="https://otelciro.com/en/news/hotel-pace-analysis-pricing-strategy-guide-2026">
  <img src="https://cdn.sanity.io/images/1la98t0z/production/e883ba49b6cf5e03174fb9b9d995395479639996-1376x768.jpg" alt="Infographic on hotel pace analysis and booking speed interpretation" width="800" />
</a>
<p>Source: <a href="https://otelciro.com">OtelCiro</a> — AI Hotel Revenue Management</p>
Related reading: How Many Hours a Year Does Your Hotel Operate Empty? The True Cost of an Empty Room
Related reading: Dynamic vs. Static Pricing: Maximize Your Profits with the Taylor Swift Effect
How to Conduct Pace Analysis
Basic Pace Comparison
For a specific target date, compare the current occupancy data X days before that date with the same period last year.
Example: Target Date July 15, 2026
| Days Remaining | Last Year's Occupancy | This Year's Occupancy | Difference | Interpretation |
|---|---|---|---|---|
| 90 days out | %15 | %22 | +%7 | Strong early demand |
| 60 days out | %35 | %45 | +%10 | Very strong pace |
| 30 days out | %55 | %68 | +%13 | Opportunity for aggressive price increase |
| 14 days out | %70 | %82 | +%12 | Maximum price can be applied |
| 7 days out | %80 | %90 | +%10 | Nearly full, premium pricing |
Pace Graphs
Monitoring pace data graphically allows you to quickly spot trends:
- Y-axis: Occupancy percentage
- X-axis: Days remaining until the target date (from 90 to 0)
- Two lines: This year vs. last year
The difference between the two lines determines the direction of your pricing decision.
Embed this image on your site
<a href="https://otelciro.com/en/news/hotel-pace-analysis-pricing-strategy-guide-2026">
  <img src="https://cdn.sanity.io/images/1la98t0z/production/bbd5fe1bd7958fd95861b71905cdb9701e352e80-1200x669.png" alt="NRevPAR (Net Revenue) Calculation Method" width="800" />
</a>
<p>Source: <a href="https://otelciro.com">OtelCiro</a> — AI Hotel Revenue Management</p>
Pick-Up Analysis
Pick-up is the net number of new reservations received within a specific time frame (usually 1 day or 1 week).
Daily Pick-Up Table Example
| Date | Starting Occupancy | New Bookings | Cancellations | Net Pick-Up | Closing Occupancy |
|---|---|---|---|---|---|
| March 1 | %45 | 8 | 2 | +6 | %51 |
| March 2 | %51 | 5 | 1 | +4 | %55 |
| March 3 | %55 | 12 | 3 | +9 | %64 |
| March 4 | %64 | 3 | 1 | +2 | %66 |
| March 5 | %66 | 15 | 2 | +13 | %79 |
The sudden increase in pick-up on March 3 and March 5 is likely due to an event or campaign. Reading this signal allows for a price increase.
Pick-Up Evaluation Criteria
| Daily Pick-Up | Assessment | Action |
|---|---|---|
| 2× above normal | Very strong demand | Increase price by 10-20% |
| Above normal | Strong demand | Increase price by 5-10% |
| Normal | Standard demand | Maintain price |
| Below normal | Weak demand | Consider promotion |
| Zero or negative | Alert | Urgent price/promotion action |
Related reading: Dynamic Pricing and AI: The Complete Guide to Hotel Price Optimization with Artificial Intelligence
Related reading: 65% of Travelers Accept Dynamic Pricing: Transparency Builds Trust
Pace-Based Pricing Strategy
Decision Matrix
| Pace Status | Lead Time | Pricing Action |
|---|---|---|
| This year > last year (+%10) | 30+ days | Increase price by 10-15% |
| This year > last year (+%5) | 30+ days | Increase price by 5-8% |
| This year = last year | 30+ days | Maintain price |
| This year < last year (-%5) | 30+ days | Open early booker rates |
| This year < last year (-%10) | Under 14 days | 15% last-minute discount |
| This year < last year (-%20) | Under 7 days | Aggressive discount of 20-30% |
Weekly Pace Review Routine
Ask yourself these questions every week:
- How is the pace for the next 30 days?
- Where do we stand compared to last year?
- Which dates show strong pace? → Increase prices
- Which dates show weak pace? → Launch promotions
- Is this week's pick-up normal?
Embed this image on your site
<a href="https://otelciro.com/en/news/hotel-pace-analysis-pricing-strategy-guide-2026">
  <img src="https://cdn.sanity.io/images/1la98t0z/production/6a97229e7f35d7df9e4e8a2cd6f4cfebc97cdc5b-1200x2150.png" alt="AI-powered dynamic pricing process" width="800" />
</a>
<p>Source: <a href="https://otelciro.com">OtelCiro</a> — AI Hotel Revenue Management</p>
Pace Analysis Pitfalls
1. Last Year's Anomalies
If there was an unusual event (pandemic, major event) during the same period last year, the comparison can be misleading. Using the average of the last 3 years is more reliable.
2. Impact of Cancellations
There can be a big difference between gross pace (including cancellations) and net pace (cancellations deducted). Always monitor net pace.
3. Shift in Segment Mix
Even if the total pace is the same, the segment mix might have changed. If the share of low-ADR segments has increased, revenue expectations will decrease.
4. Ignoring Price Impact
Achieving a high pace with low prices is misleading. Always evaluate pace in conjunction with ADR.
Related reading: What Is Dynamic Pricing? 5 Ways to Increase Your Hotel Revenue
Automated Pace Analysis with OtelCiro
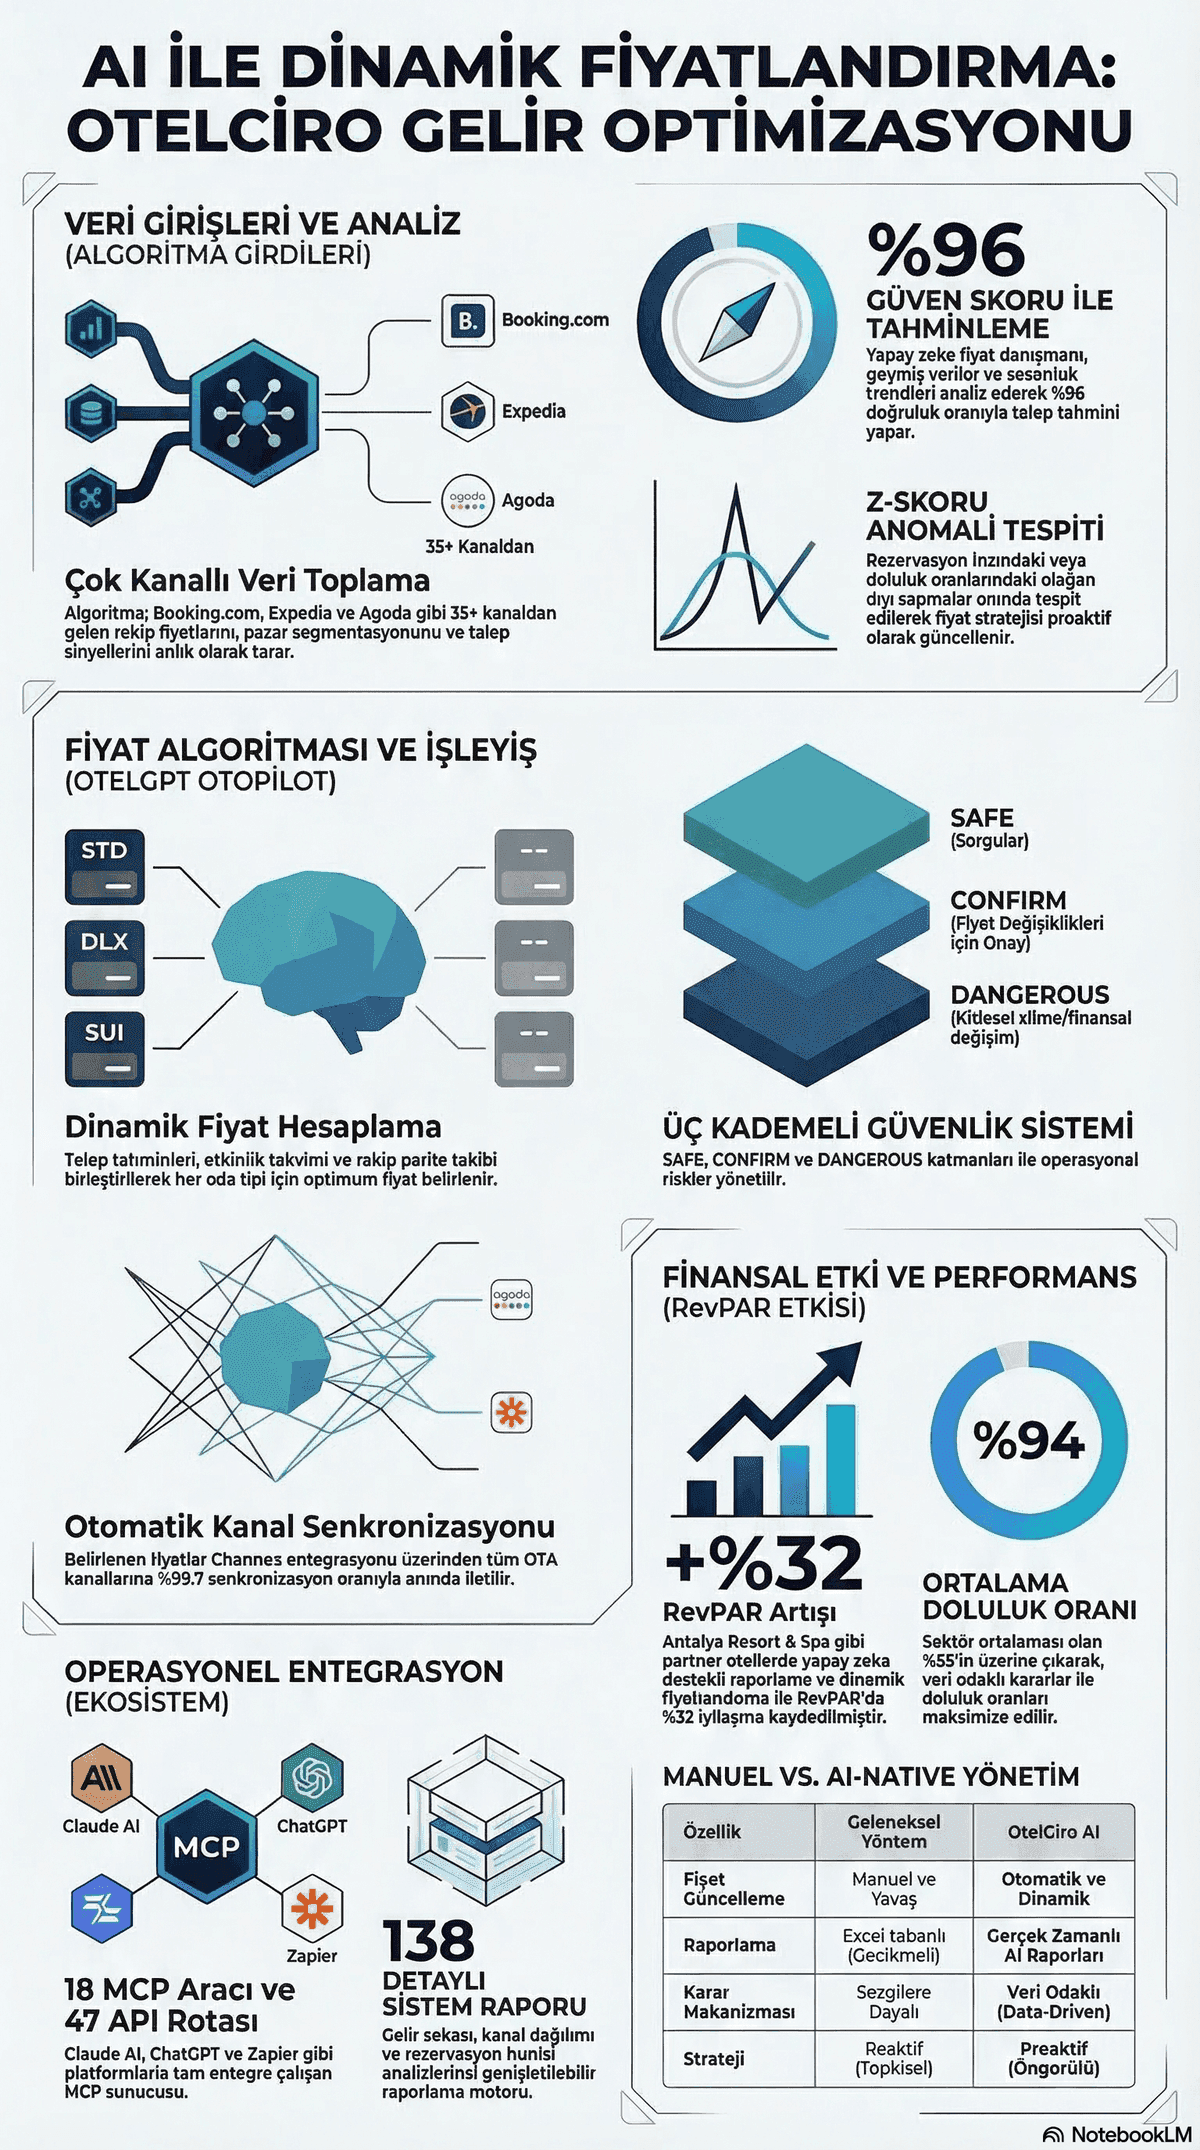
OtelCiro's reporting module tracks pace data in real-time and automatically compares it with past periods. AI-powered anomaly detection instantly alerts you to unusual pick-up changes and suggests pricing actions.
- Real-time pace dashboard: Instant occupancy and pace for every date
- Multi-year comparison: 3-year trend analysis
- Segment-based pace: Separate pace tracking for each segment
- Automated price recommendation: AI-powered pricing advice based on pace data
Explore the OtelCiro Reporting Module
Related topics: Hotel Demand Forecasting and Occupancy-Based Pricing.
Conclusion
Pace analysis is the most reliable decision support tool in hotel revenue management. Read future demand by comparing it with the past, monitor pick-up data, and base your pricing decisions on pace data. Establish a weekly pace review routine and develop a proactive revenue management culture.
Automate your pace analysis with OtelCiro's reporting module and make data-driven pricing decisions.
![Hotel Ancillary Revenue: Monetizing Spa, F&B & Activities [2026 Guide]](https://cdn.sanity.io/images/1la98t0z/production/cfce3407a5ef8f70edd19853e8059317fca7b6a6-2752x1536.jpg?w=1920&q=50&auto=format&fit=max)
![FIFA 2026 World Cup: Hotel Dynamic Pricing Strategy [2026 Guide]](https://cdn.sanity.io/images/1la98t0z/production/7a76affe61333341ec47bb0c705011068a1afd24-2752x1536.jpg?w=1920&q=50&auto=format&fit=max)